The Beauty of ‘Draw A Search’
In 2010, Rightmove launched ‘Draw A Search’, an amazing new feature which allowed you to draw their own area on a map and then search for properties in that unique area. Five years on, Draw A Search remains an important part of the housing search toolbox and allows you to create tailor-made neighbourhoods or regions where you want to buy or rent.
Perhaps more surprisingly though, it has also produced some fascinating and beautiful data.
The Rightmove archives are now full of hundreds of millions of your drawn search areas. However, because of the vast quantity of data, it’s almost impossible to make sense of it so we worked with Dr Alasdair Rae of the University of Sheffield to create a series of maps which illustrate the imagination, skill and dedication of Rightmove users in creating their own unique search areas.
As you’ll see, some people know exactly where they want to search and draw really specific neighbourhoods, others search the entire country, and others draw searches based on things like road and rail lines, or natural features like rivers and coastlines.
The maps below provide an overview of Draw A Search, based on one month of data (click on the image to zoom for more detail). When you put it all together, what you get is an illuminating insight into how home-hunters understand the geography of our nation.
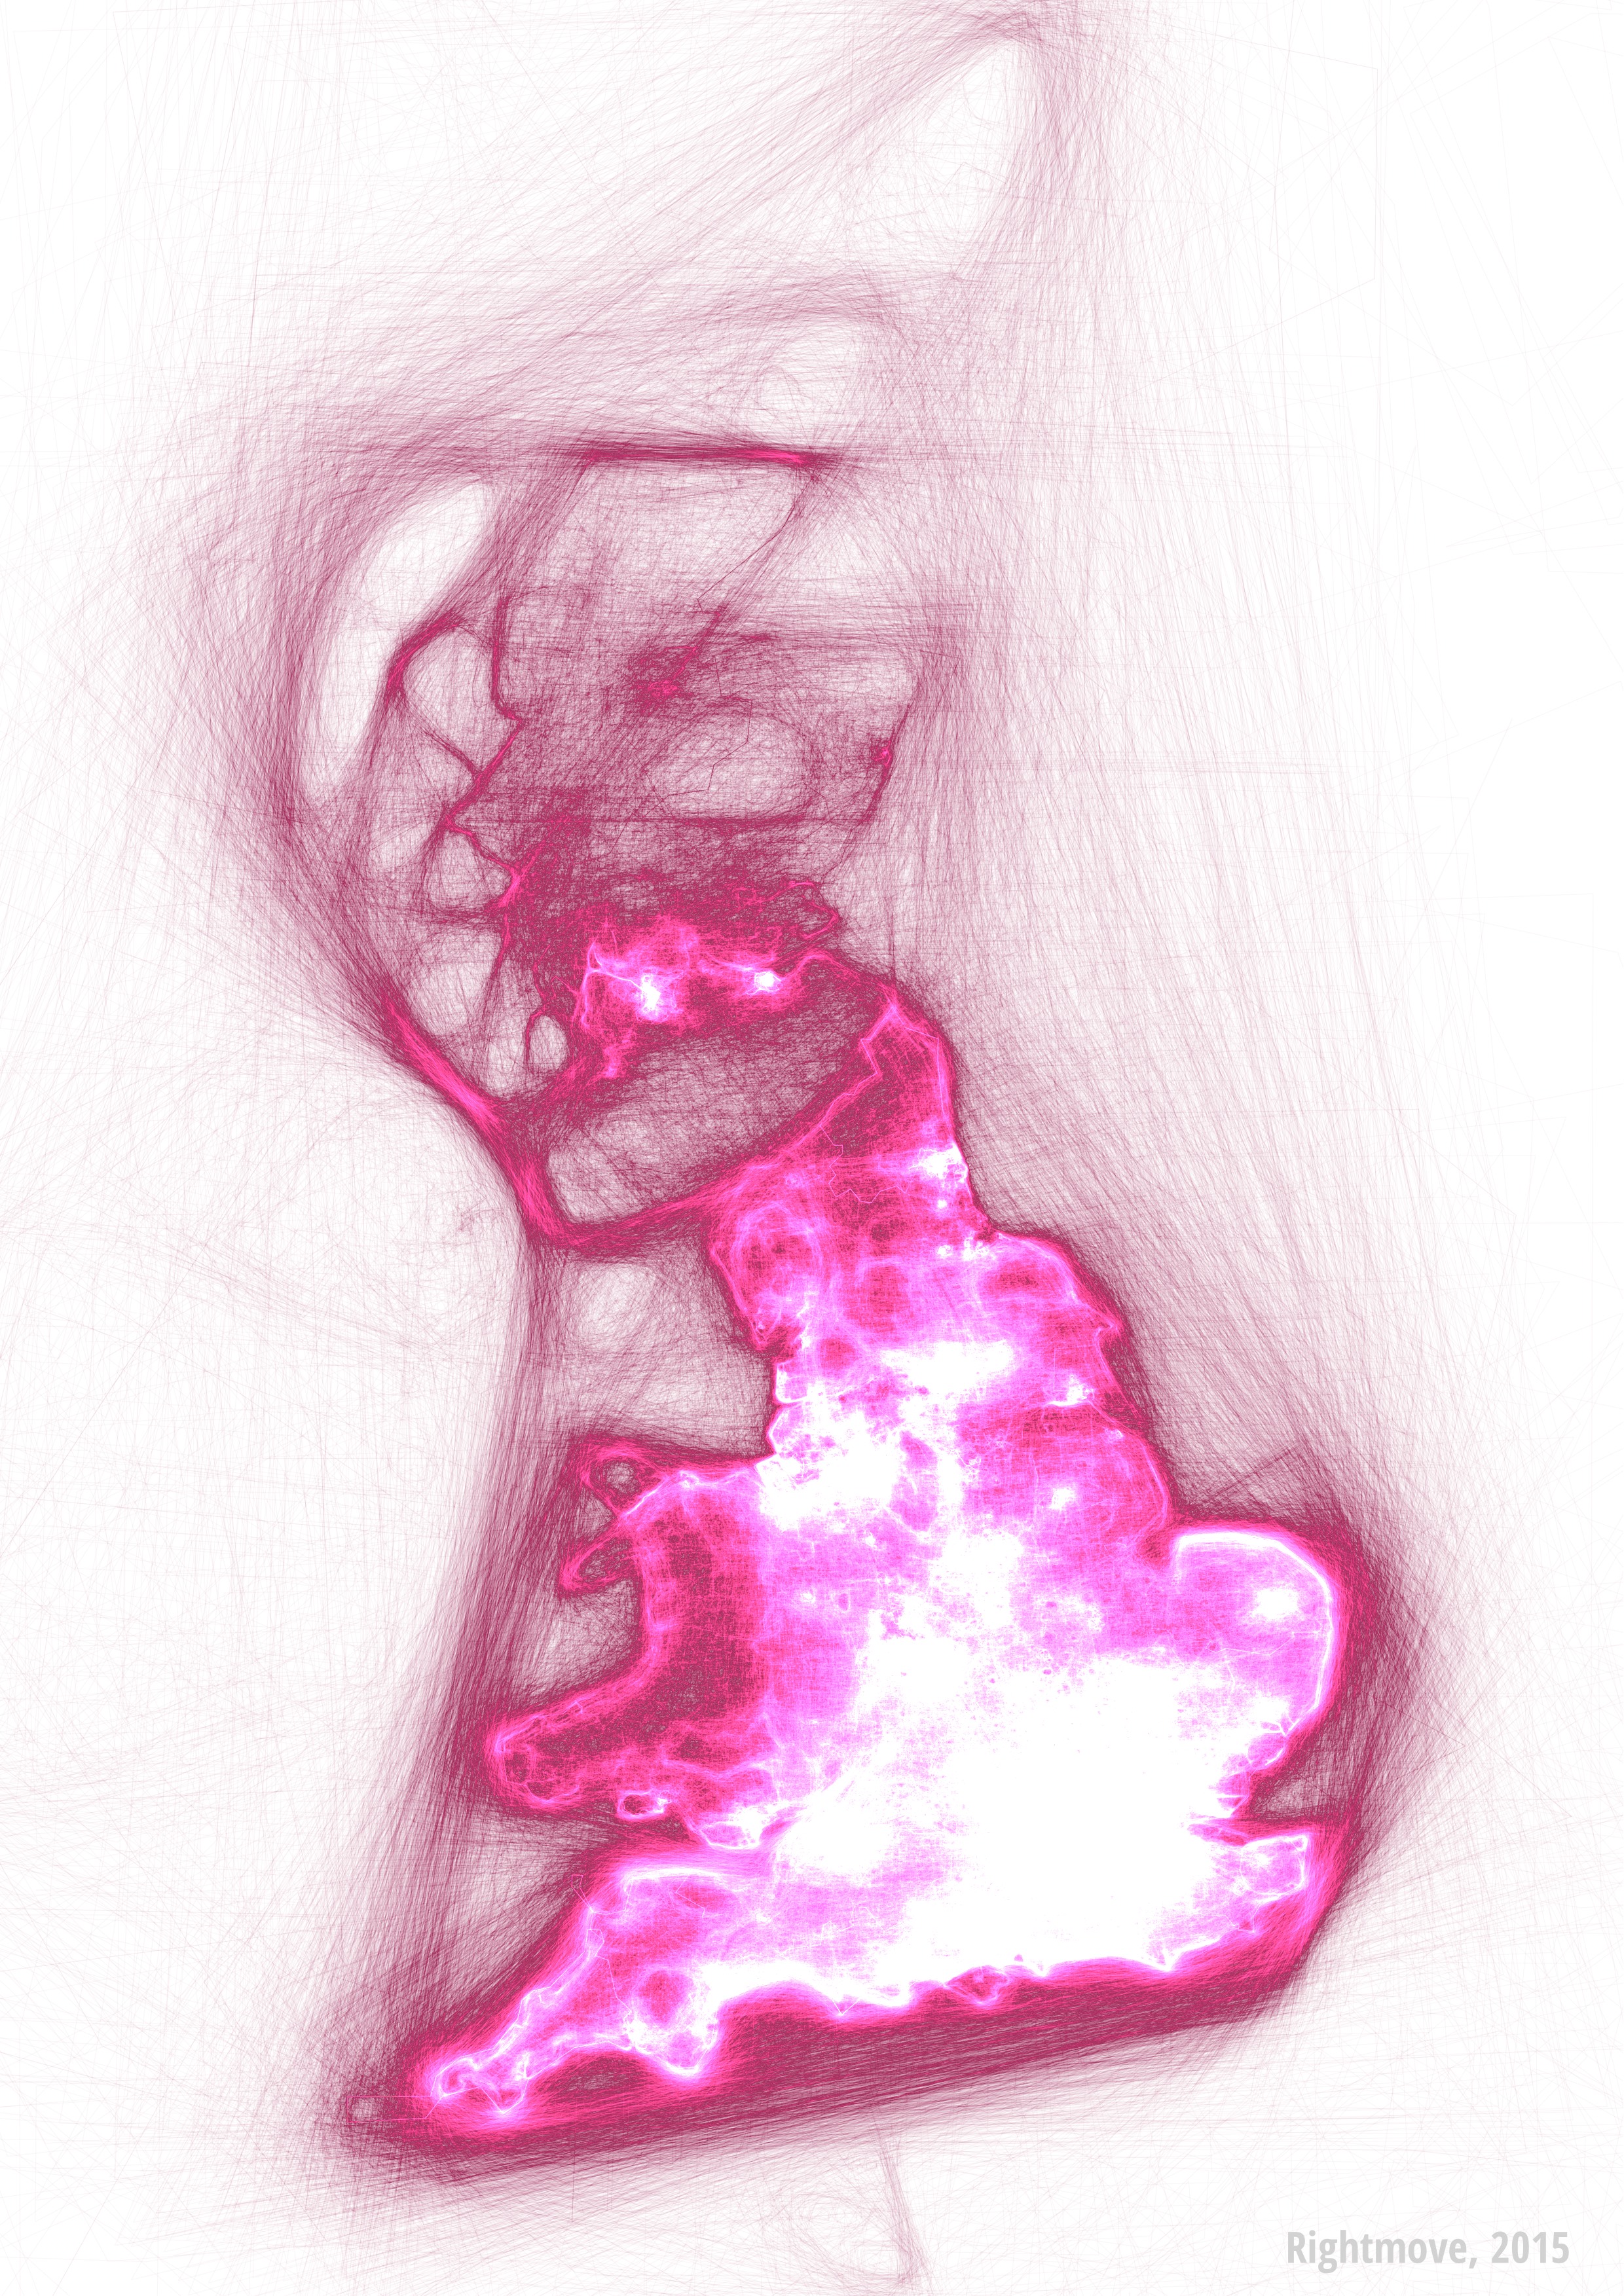
The first map shows all the search areas people drew during a single month – only Draw-a-Search lines are shown. There are about 1 million in total so we’ve made them a little transparent to make it easier to decipher. The brighter the colour, the more searches there are. The glowing white areas are particular Draw A Search hotspots.
At the national level a few things are immediately obvious:
- Rightmove users have redrawn Britain in a rather beautiful way
- The map doesn’t simply reflect where most people live – it also highlights areas of outstanding natural beauty, such as Cornwall and the north Norfolk coast.
- Some people are drawing areas around the entire country
- The border between England and Scotland comes out clearly
- Almost the entire South East of England is glowing white hot
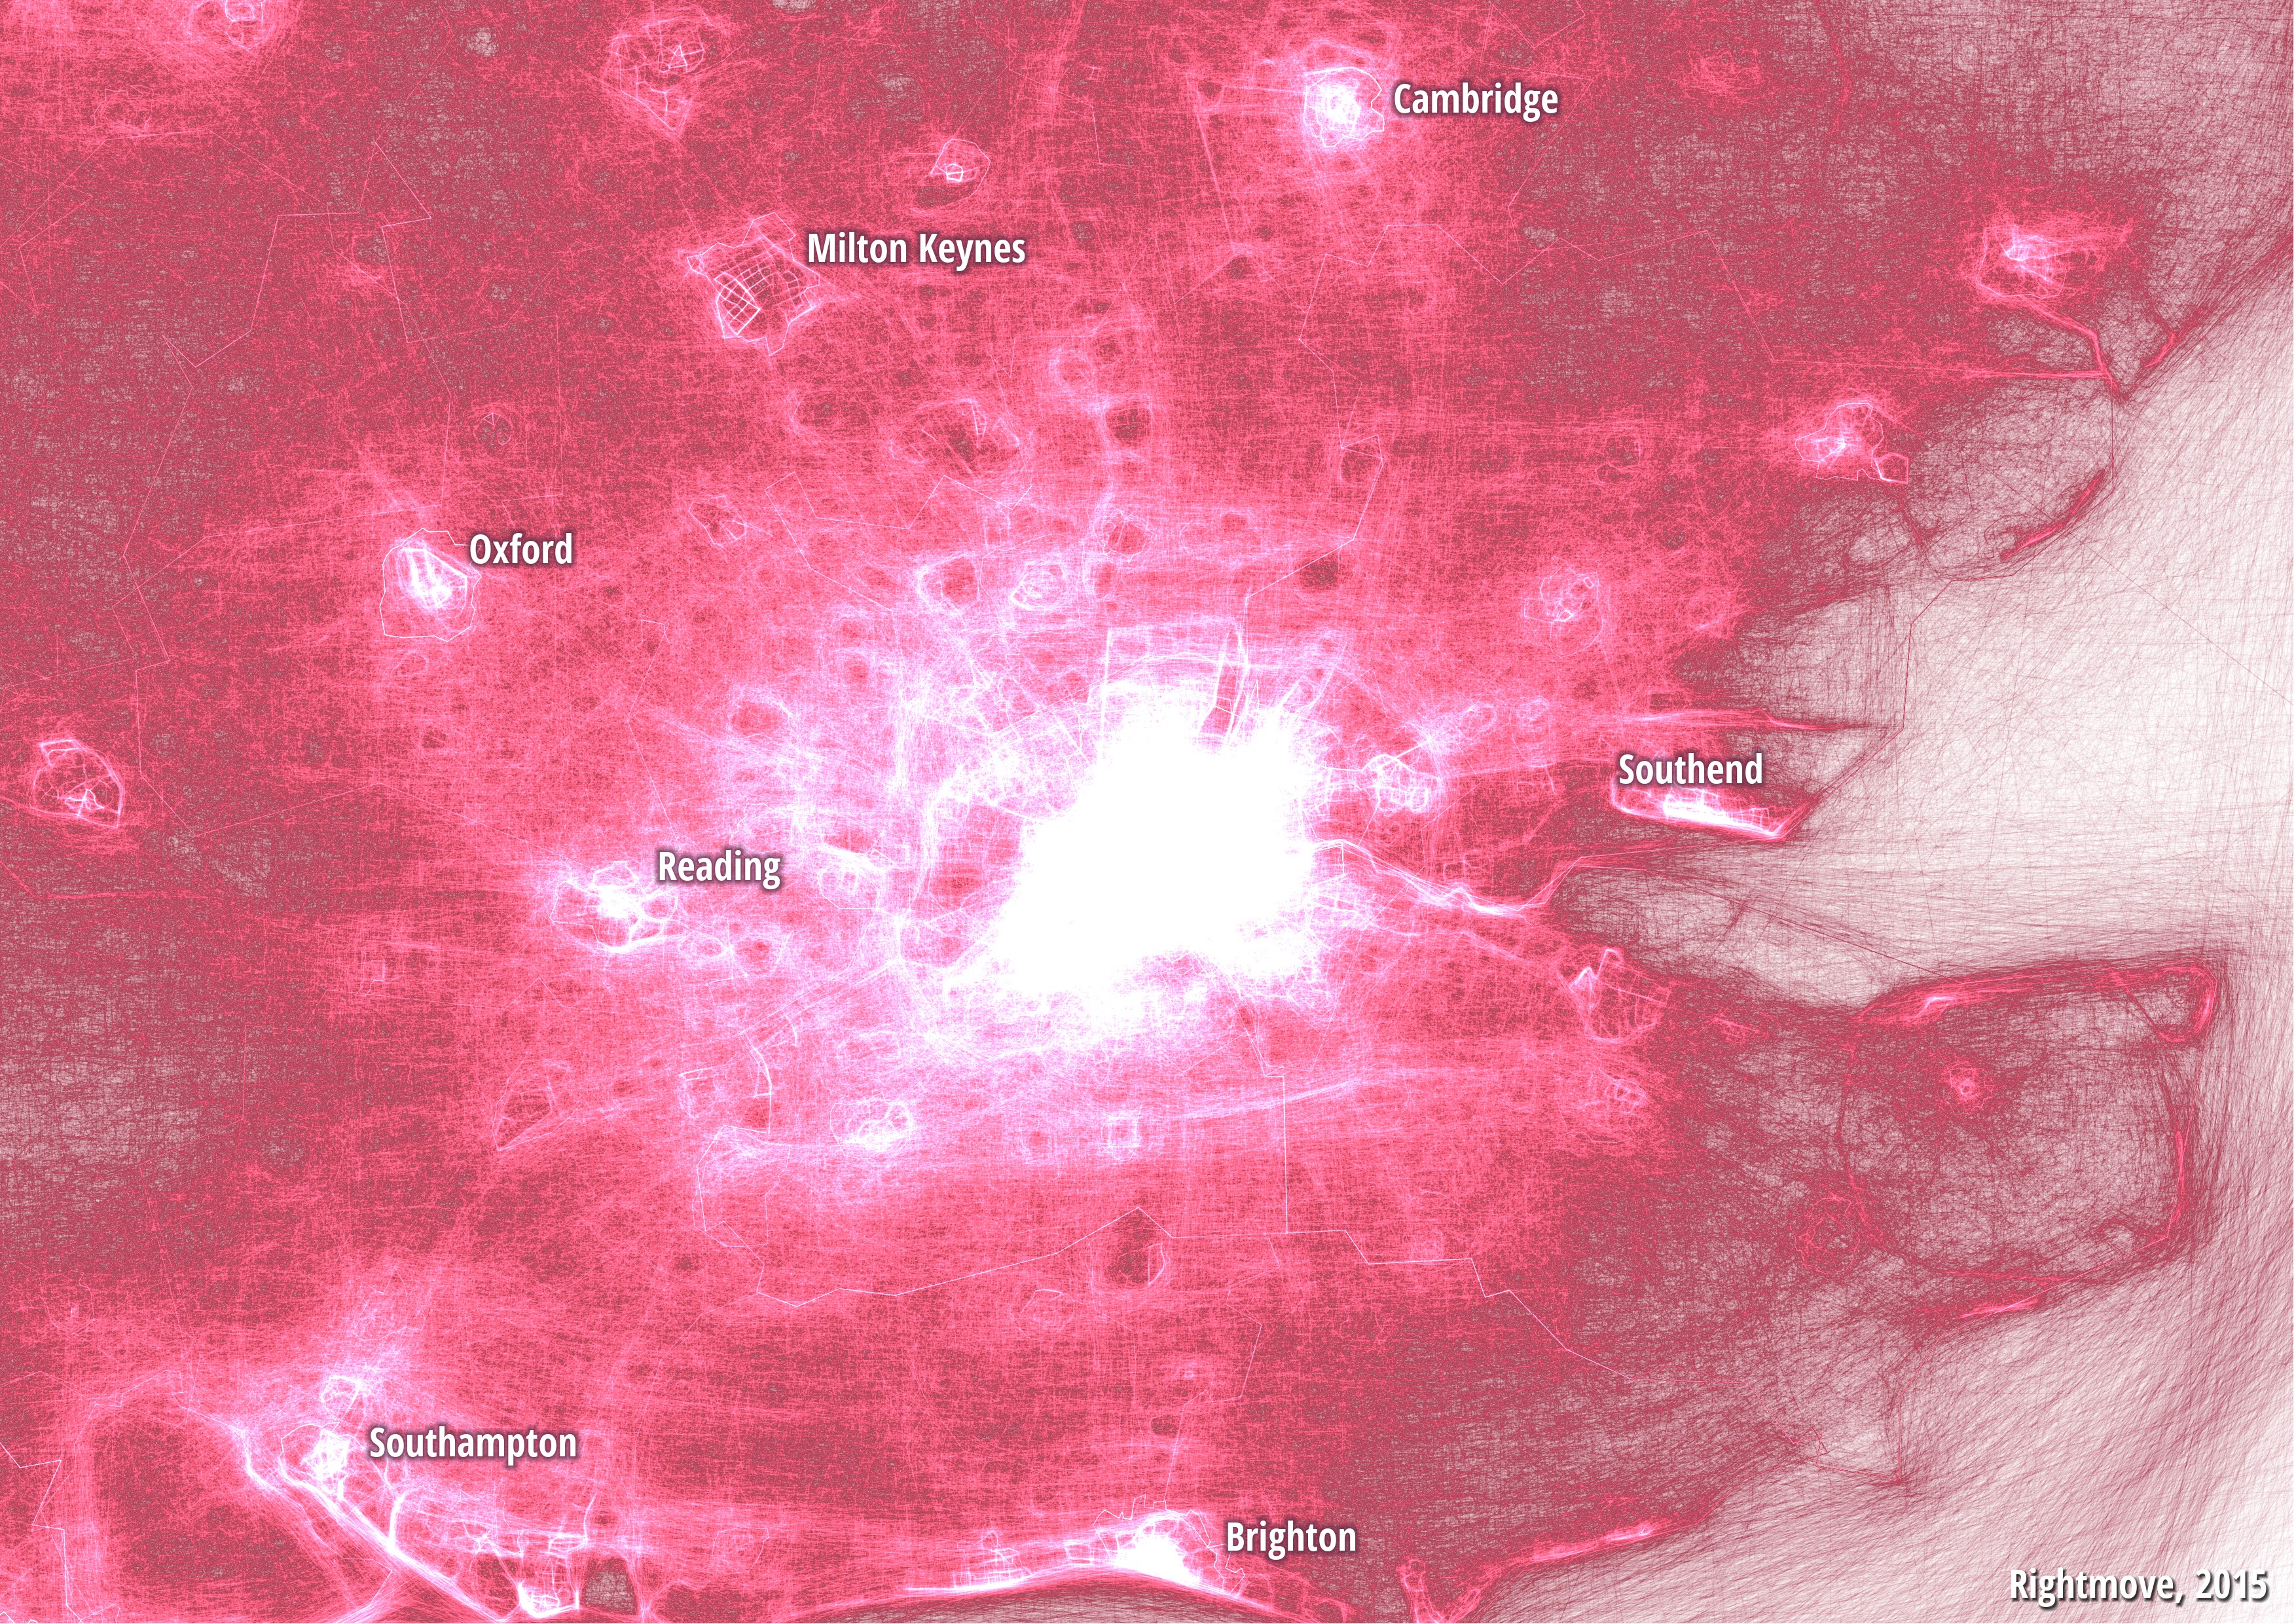
When we zoom in to the South East and adjust the map shading so that we can see more detail, it’s even more revealing. Inner London still glows the brightest but other towns and cities begin to emerge more clearly. For example, in the map below, Cambridge, Milton Keynes, Oxford, Reading, Southampton, Brighton and Southend are particular Draw A Search hotspots. Perhaps most interesting at this scale is the very clear grid street pattern in Milton Keynes which users have clearly used to help them draw their search areas.
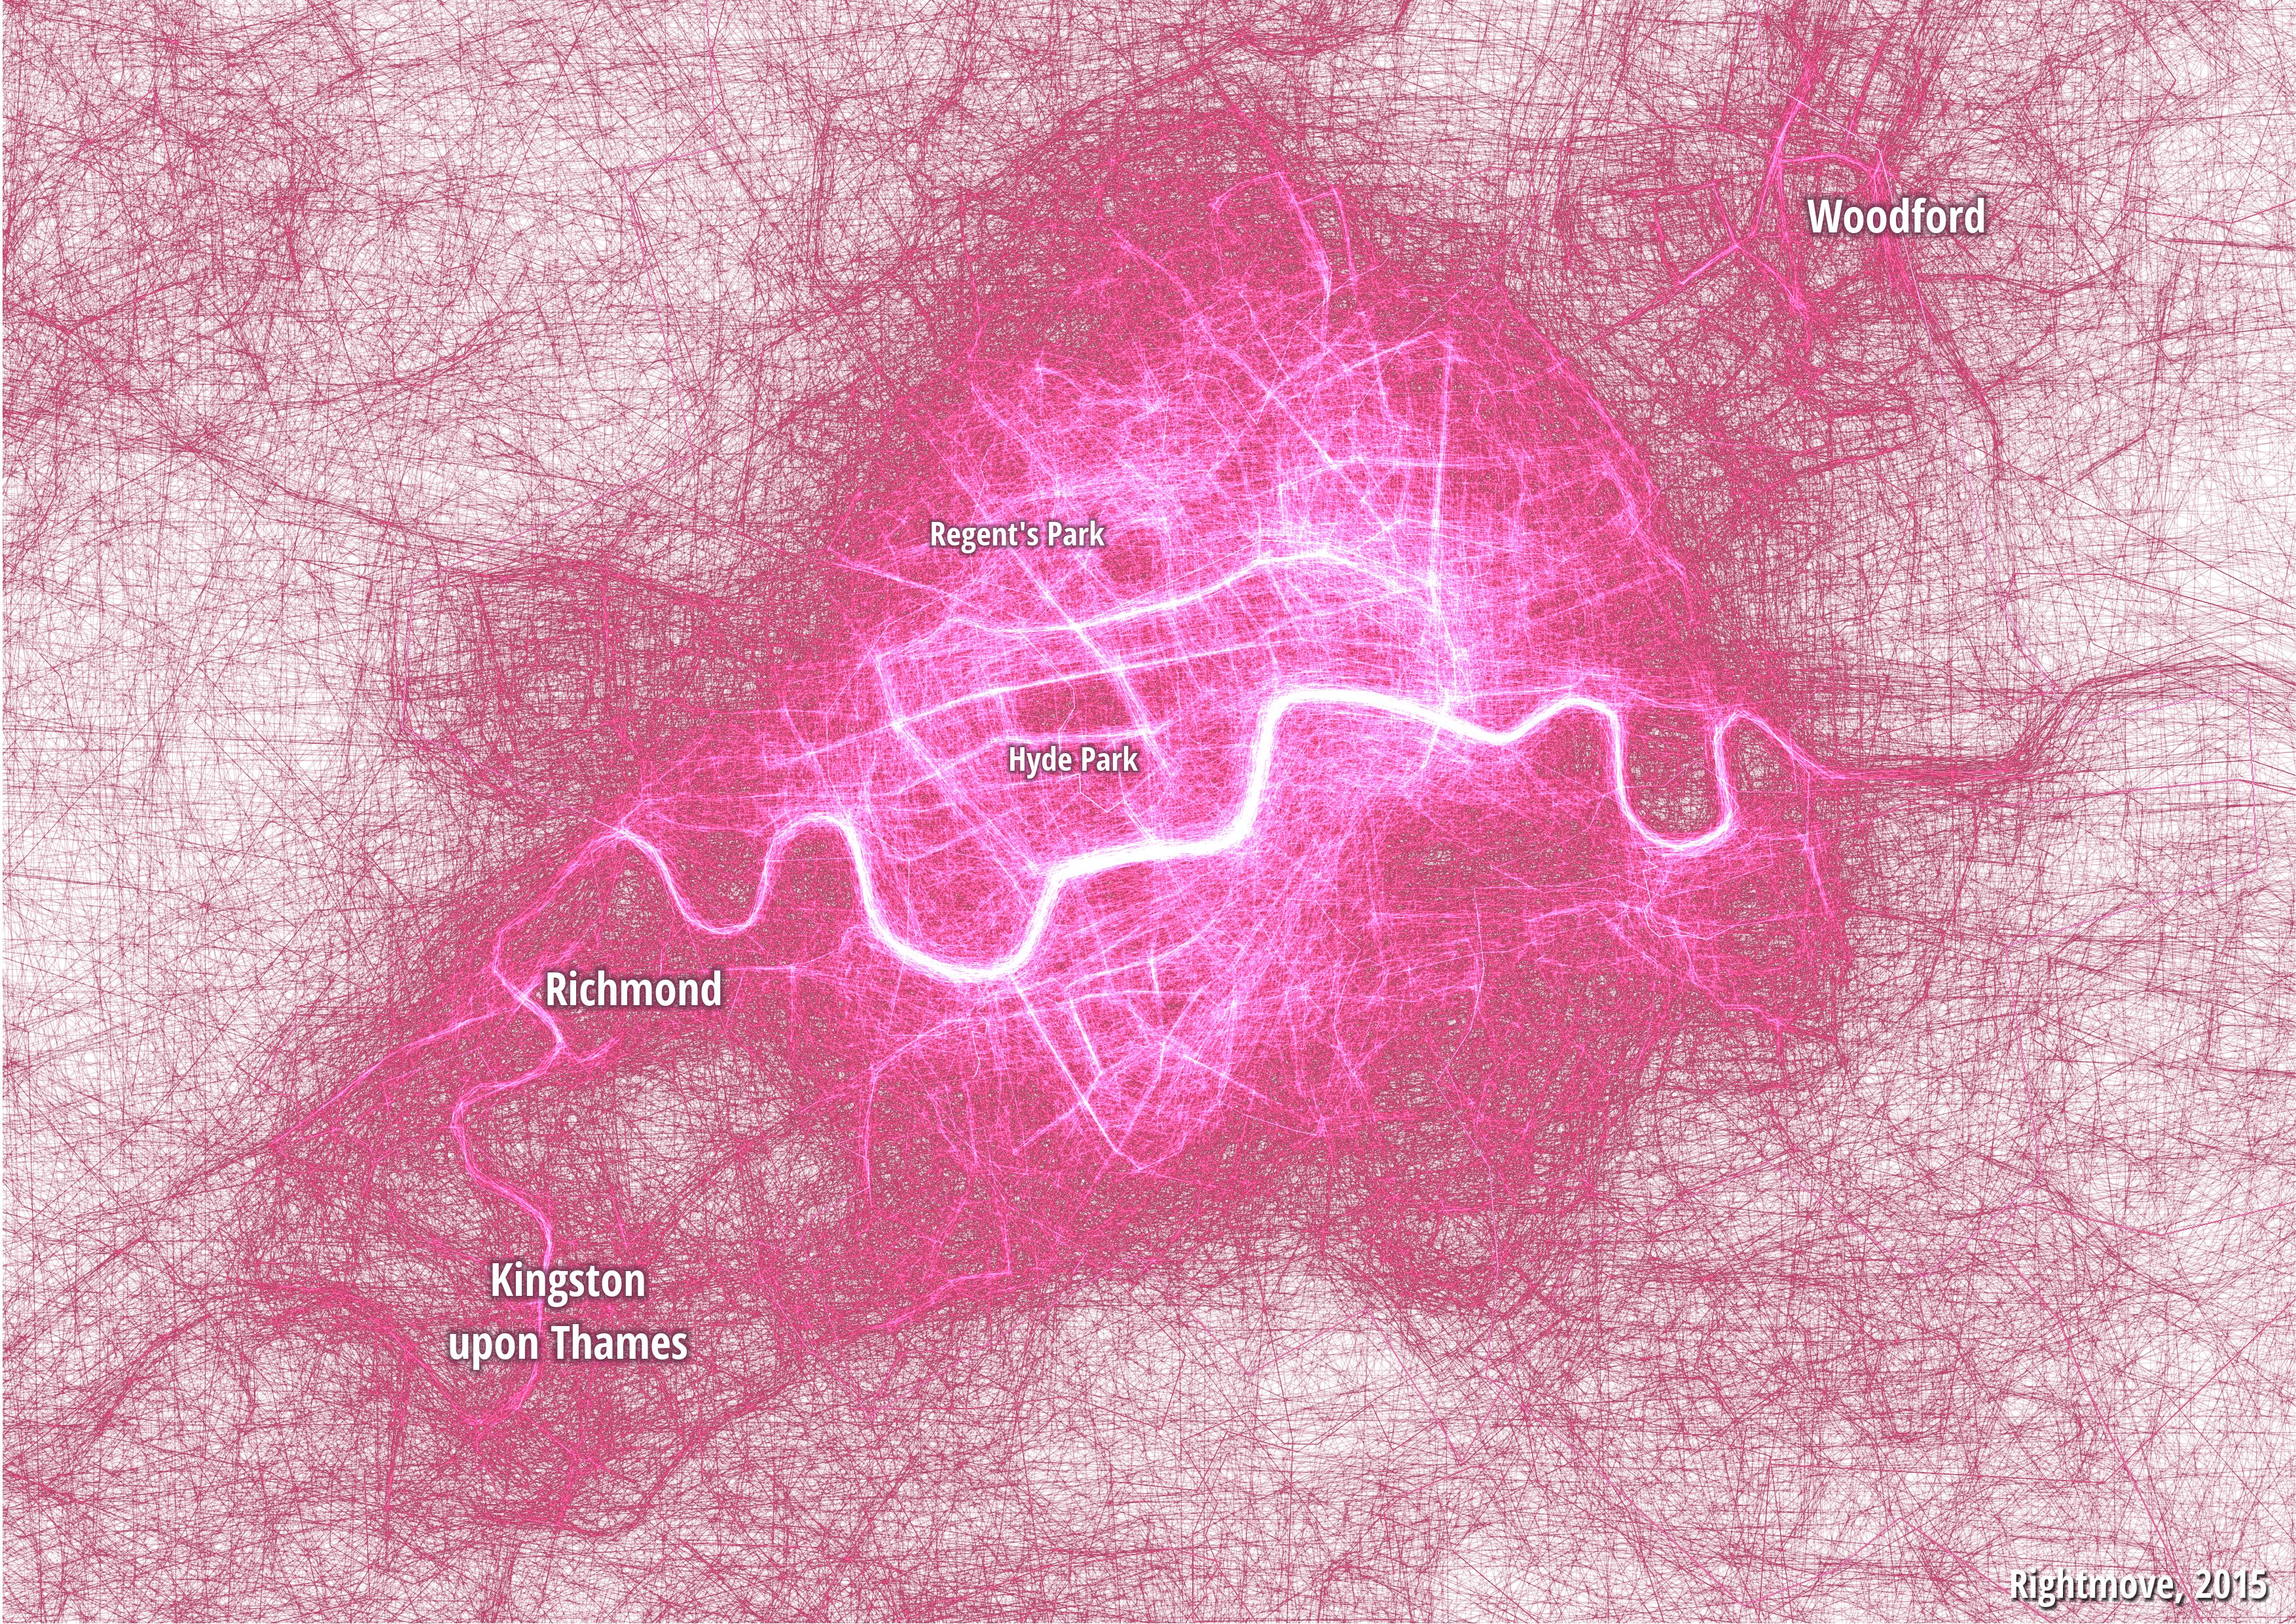
Finally, when we zoom right in to central London we can see which areas emerge most clearly from users’ drawn searches. The Thames stands out as being a clear point of reference for Rightmove users searching in London, as you’d expect, and it’s particularly clear all the way through Richmond and down to Kingston upon Thames.
Beyond the river, Hyde Park and Regent’s Park are clear points of reference and are often traced around using the Draw A Search tool. Much of the road network of inner London is also immediately obvious but what is possibly more of a surprise is the concentration of drawn searches in Woodford. Perhaps the home-hunters of Woodford just can’t get enough of Draw A Search!
No matter how you look at it, you have redrawn the country in an intricate and captivating way. We hope you’ve enjoyed this little insight into the Rightmove data archive.
Mapping by Alasdair Rae, University of Sheffield
Twitter @undertheraedar


