
House Prices in YO1
House prices in YO1 have an overall average of £318,946 over the last year.
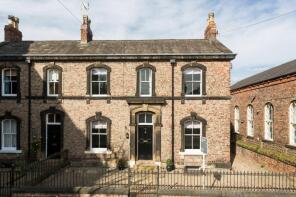
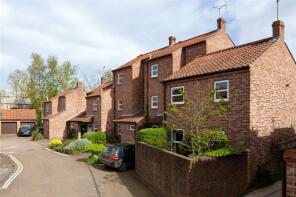
The majority of properties sold in YO1 during the last year were flats, selling for an average price of £282,282. Terraced properties sold for an average of £361,115, with semi-detached properties fetching £584,167.
Overall, the historical sold prices in YO1 over the last year were 28% down on the previous year and 18% down on the 2021 peak of £387,857.
Properties Sold
22, Victor Street, York YO1 6HQ
| Today | See what it's worth now |
| 21 Feb 2025 | £189,000 |
| 7 Oct 2005 | £110,000 |
8, Falkland Street, York YO1 6DY
| Today | See what it's worth now |
| 14 Feb 2025 | £280,000 |
| 30 Apr 1999 | £68,000 |
No other historical records.
Flat 2, 21, Priory Street, York YO1 6ET


| Today | See what it's worth now |
| 28 Jan 2025 | £110,000 |
No other historical records.
Apartment 63 Core 2, Leetham House, Pound Lane, York YO1 7PB

| Today | See what it's worth now |
| 24 Jan 2025 | £155,000 |
No other historical records.
4, Biba House, St Saviours Place, York YO1 7PJ

| Today | See what it's worth now |
| 17 Jan 2025 | £187,500 |
| 6 Nov 2015 | £186,000 |
No other historical records.
5, Bishops Court, York YO1 6EU
| Today | See what it's worth now |
| 16 Jan 2025 | £335,000 |
| 7 Apr 1997 | £67,250 |
27, St Andrew Place, York YO1 7BP
| Today | See what it's worth now |
| 13 Jan 2025 | £290,000 |
| 14 Aug 2019 | £277,500 |
Apartment 2, 5, St Leonards Place, York YO1 7HF

| Today | See what it's worth now |
| 19 Dec 2024 | £850,000 |
| 31 Mar 2017 | £645,000 |
No other historical records.
Flat 21, Popes Head Court, Peter Lane, York YO1 8SU
| Today | See what it's worth now |
| 19 Dec 2024 | £290,000 |
| 8 Oct 2012 | £184,000 |
No other historical records.
Apartment 26, Kings Hudson Quarter, Toft Green, York YO1 6AE

| Today | See what it's worth now |
| 6 Dec 2024 | £233,000 |
No other historical records.
1, Constantine House, Fetter Lane, York YO1 6DF

| Today | See what it's worth now |
| 28 Nov 2024 | £215,000 |
| 19 Nov 2002 | £135,950 |
No other historical records.
46, Kyme Street, York YO1 6HG
| Today | See what it's worth now |
| 18 Nov 2024 | £270,000 |
No other historical records.
Apartment 11, Bellerby Court, Palmer Lane, York YO1 7AF

| Today | See what it's worth now |
| 15 Nov 2024 | £218,000 |
| 14 Oct 2019 | £214,634 |
No other historical records.
35, Hampden Street, York YO1 6EA
| Today | See what it's worth now |
| 29 Oct 2024 | £292,500 |
| 21 Jul 2000 | £70,000 |
No other historical records.
1, Cordwainers Court, Black Horse Lane, York YO1 7NE

| Today | See what it's worth now |
| 21 Oct 2024 | £260,000 |
No other historical records.
3, Falkland Street, York YO1 6DY
| Today | See what it's worth now |
| 20 Sep 2024 | £350,000 |
| 22 Nov 2017 | £265,400 |
Apartment 23, Cardinal Court, Bishophill Junior, York YO1 6ES

| Today | See what it's worth now |
| 20 Sep 2024 | £415,000 |
| 25 Nov 2018 | £399,999 |
No other historical records.
Apartment F, The Old Fire Station, Peckitt Street, York YO1 9SF

| Today | See what it's worth now |
| 4 Sep 2024 | £520,000 |
| 30 Oct 2020 | £525,000 |
No other historical records.
Apartment 63, Bellerby Court, Palmer Lane, York YO1 7AF
| Today | See what it's worth now |
| 30 Aug 2024 | £232,500 |
| 9 Sep 2019 | £220,000 |
No other historical records.
13, Priory Street, York YO1 6ET
| Today | See what it's worth now |
| 29 Aug 2024 | £650,000 |
No other historical records.
11, Pear Tree Court, York YO1 7DF
| Today | See what it's worth now |
| 29 Aug 2024 | £380,000 |
No other historical records.
27, St Andrewgate, York YO1 7BR

| Today | See what it's worth now |
| 28 Aug 2024 | £422,500 |
| 2 Sep 1999 | £122,000 |
No other historical records.
15, Covent House, George Street, York YO1 9QE

| Today | See what it's worth now |
| 23 Aug 2024 | £148,000 |
| 16 Aug 2021 | £136,000 |
31, Rowntree Wharf, York YO1 9XA

| Today | See what it's worth now |
| 21 Aug 2024 | £195,000 |
| 26 Jun 2002 | £125,500 |
No other historical records.
8, Malt Shovel Court, York YO1 9TB

| Today | See what it's worth now |
| 19 Aug 2024 | £680,000 |
| 9 May 2011 | £420,000 |
No other historical records.
Find out how much your property is worth
The following agents can provide you with a free, no-obligation valuation. Simply select the ones you'd like to hear from.
Sponsored
All featured agents have paid a fee to promote their valuation expertise.

Bridgfords
York
Dacre Son & Hartley
Ilkley

Reeds Rains
York

Yopa
Nationwide

Carter Jonas
York

TAUK
Covering Nationwide
Get ready with a Mortgage in Principle
- Personalised result in just 20 minutes
- Find out how much you can borrow
- Get viewings faster with agents
- No impact on your credit score
What's your property worth?
Source Acknowledgement: © Crown copyright. England and Wales house price data is publicly available information produced by the HM Land Registry.This material was last updated on 17 April 2025. It covers the period from 1 January 1995 to 28 February 2025 and contains property transactions which have been registered during that period. Contains HM Land Registry data © Crown copyright and database right 2025. This data is licensed under the Open Government Licence v3.0.
Disclaimer: Rightmove.co.uk provides this HM Land Registry data "as is". The burden for fitness of the data relies completely with the user and is provided for informational purposes only. No warranty, express or implied, is given relating to the accuracy of content of the HM Land Registry data and Rightmove does not accept any liability for error or omission. If you have found an error with the data or need further information please contact HM Land Registry.
Permitted Use: Viewers of this Information are granted permission to access this Crown copyright material and to download it onto electronic, magnetic, optical or similar storage media provided that such activities are for private research, study or in-house use only. Any other use of the material requires the formal written permission of Land Registry which can be requested from us, and is subject to an additional licence and associated charge.
Map data ©OpenStreetMap contributors.
Rightmove takes no liability for your use of, or reliance on, Rightmove's Instant Valuation due to the limitations of our tracking tool listed here. Use of this tool is taken entirely at your own risk. All rights reserved.