
House Prices in Wigston
House prices in Wigston have an overall average of £267,988 over the last year.
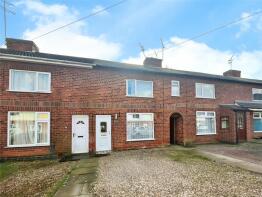
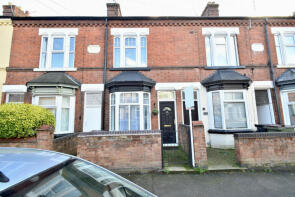
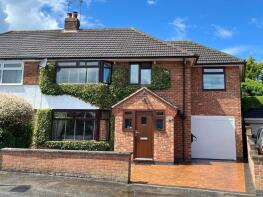
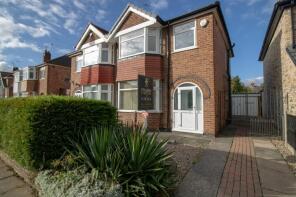
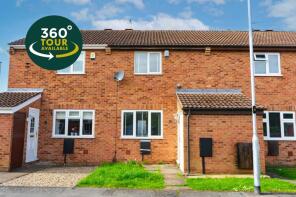
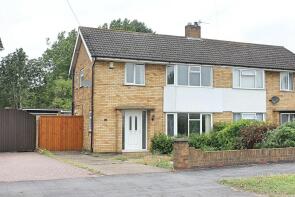
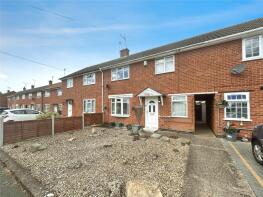
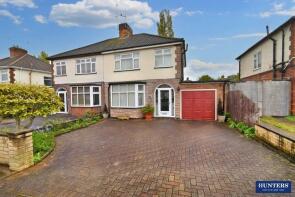
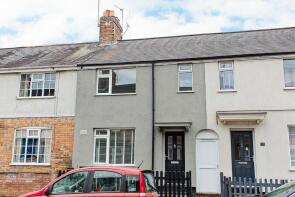
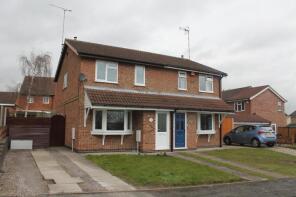
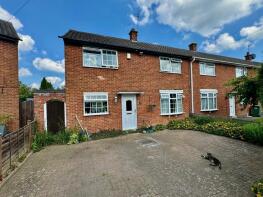
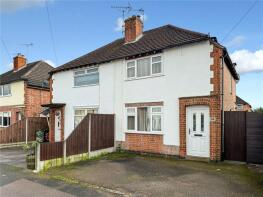
The majority of properties sold in Wigston during the last year were semi-detached properties, selling for an average price of £261,579. Terraced properties sold for an average of £199,270, with detached properties fetching £380,822.
Overall, the historical sold prices in Wigston over the last year were 3% down on the previous year and 2% down on the 2022 peak of £272,573.
Properties Sold
34, Highgate Drive, Leicester LE2 6HH

| Today | See what it's worth now |
| 20 Feb 2025 | £375,025 |
| 3 Dec 2013 | £174,500 |
No other historical records.
9, Primrose Wray Road, Wigston, Leicestershire LE18 3AN


| Today | See what it's worth now |
| 14 Feb 2025 | £270,000 |
| 30 Jun 2022 | £289,995 |
No other historical records.
8, Chatsworth Avenue, Wigston, Leicestershire LE18 4LF
| Today | See what it's worth now |
| 14 Feb 2025 | £192,500 |
| 9 Dec 2022 | £165,000 |
No other historical records.
39, Mablowe Field, Wigston, Leicestershire LE18 3UJ

| Today | See what it's worth now |
| 7 Feb 2025 | £252,500 |
| 29 Jun 2021 | £242,000 |
7, Rawson Drive, Wigston, Leicestershire LE18 3AF

| Today | See what it's worth now |
| 7 Feb 2025 | £390,000 |
| 6 Dec 2021 | £359,950 |
No other historical records.
9, Bassett Street, Wigston, Leicestershire LE18 4PD
| Today | See what it's worth now |
| 31 Jan 2025 | £185,000 |
| 11 Oct 2023 | £155,000 |
No other historical records.
12, Cheddar Road, Wigston, Leicestershire LE18 3PH
| Today | See what it's worth now |
| 30 Jan 2025 | £355,000 |
No other historical records.
19, Highgate Drive, Leicester LE2 6HJ
| Today | See what it's worth now |
| 24 Jan 2025 | �£290,000 |
No other historical records.
6, Lime Kilns, Wigston, Leicestershire LE18 3ST
| Today | See what it's worth now |
| 24 Jan 2025 | £197,000 |
| 18 Dec 2020 | £161,000 |
150, Dorset Avenue, Wigston, Leicestershire LE18 4WF
| Today | See what it's worth now |
| 16 Jan 2025 | £251,500 |
| 22 Mar 2002 | £72,000 |
No other historical records.
28, Hazelwood Road, Wigston, Leicestershire LE18 4LR
| Today | See what it's worth now |
| 16 Jan 2025 | £180,000 |
No other historical records.
123, Aylestone Lane, Wigston, Leicestershire LE18 1BB
| Today | See what it's worth now |
| 13 Jan 2025 | £273,750 |
No other historical records.
2, Lansdowne Grove, Wigston, Leicestershire LE18 4LU

| Today | See what it's worth now |
| 10 Jan 2025 | £165,000 |
No other historical records.
23, Pullman Road, Wigston, Leicestershire LE18 2DA
| Today | See what it's worth now |
| 7 Jan 2025 | £205,000 |
No other historical records.
32, Broughtons Field, Wigston, Leicestershire LE18 3LJ
| Today | See what it's worth now |
| 6 Jan 2025 | £240,000 |
| 29 Apr 2016 | £159,950 |
5, Kilby Bridge Cottage, Welford Road, Wigston, Leicestershire LE18 3TF

| Today | See what it's worth now |
| 20 Dec 2024 | £255,000 |
| 19 Jun 2014 | £95,000 |
No other historical records.
62, Hazelwood Road, Wigston, Leicestershire LE18 4LS
| Today | See what it's worth now |
| 19 Dec 2024 | £236,000 |
| 12 Dec 2002 | £87,000 |
No other historical records.
4, Gregory Way, Wigston, Leicestershire LE18 3UT

| Today | See what it's worth now |
| 18 Dec 2024 | £340,000 |
| 27 Jun 2019 | £301,995 |
No other historical records.
114, Kingston Avenue, Wigston, Leicestershire LE18 1HN
| Today | See what it's worth now |
| 18 Dec 2024 | £235,000 |
| 26 Oct 2017 | £159,000 |
11, Ramsdean Avenue, Wigston, Leicestershire LE18 1DX
| Today | See what it's worth now |
| 16 Dec 2024 | £270,000 |
| 26 Jun 2023 | £280,000 |
83, Burleigh Avenue, Wigston, Leicestershire LE18 1FN
| Today | See what it's worth now |
| 16 Dec 2024 | £210,000 |
| 28 Apr 1995 | £44,250 |
No other historical records.
61, Park Road, Wigston, Leicestershire LE18 4QD
| Today | See what it's worth now |
| 16 Dec 2024 | £164,000 |
| 17 Feb 1997 | £28,000 |
No other historical records.
163, Mere Road, Wigston, Leicestershire LE18 3RN
| Today | See what it's worth now |
| 16 Dec 2024 | £325,000 |
| 21 Jan 2005 | £162,000 |
No other historical records.
7, Penryn Drive, Wigston, Leicestershire LE18 2HU
| Today | See what it's worth now |
| 12 Dec 2024 | £300,000 |
| 4 May 2018 | £217,500 |
42, Windlass Drive, Wigston, Leicestershire LE18 4NW

| Today | See what it's worth now |
| 11 Dec 2024 | £225,000 |
| 5 Mar 2021 | £180,000 |
Get ready with a Mortgage in Principle
- Personalised result in just 20 minutes
- Find out how much you can borrow
- Get viewings faster with agents
- No impact on your credit score
What's your property worth?
Source Acknowledgement: © Crown copyright. England and Wales house price data is publicly available information produced by the HM Land Registry.This material was last updated on 17 April 2025. It covers the period from 1 January 1995 to 28 February 2025 and contains property transactions which have been registered during that period. Contains HM Land Registry data © Crown copyright and database right 2025. This data is licensed under the Open Government Licence v3.0.
Disclaimer: Rightmove.co.uk provides this HM Land Registry data "as is". The burden for fitness of the data relies completely with the user and is provided for informational purposes only. No warranty, express or implied, is given relating to the accuracy of content of the HM Land Registry data and Rightmove does not accept any liability for error or omission. If you have found an error with the data or need further information please contact HM Land Registry.
Permitted Use: Viewers of this Information are granted permission to access this Crown copyright material and to download it onto electronic, magnetic, optical or similar storage media provided that such activities are for private research, study or in-house use only. Any other use of the material requires the formal written permission of Land Registry which can be requested from us, and is subject to an additional licence and associated charge.
Map data ©OpenStreetMap contributors.
Rightmove takes no liability for your use of, or reliance on, Rightmove's Instant Valuation due to the limitations of our tracking tool listed here. Use of this tool is taken entirely at your own risk. All rights reserved.