
House Prices in Whitby
House prices in Whitby have an overall average of £264,462 over the last year.
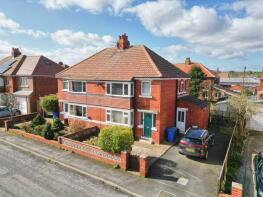
The majority of properties sold in Whitby during the last year were semi-detached properties, selling for an average price of £255,601. Terraced properties sold for an average of £248,310, with flats fetching £181,232.
Overall, the historical sold prices in Whitby over the last year were 5% up on the previous year and 1% down on the 2022 peak of £267,301.
Properties Sold
30, Ash Grove, Whitby, North Yorkshire YO21 1HU
| Today | See what it's worth now |
| 14 Feb 2025 | £262,000 |
| 17 Dec 2008 | £151,500 |
No other historical records.
29, Bracken Close, Whitby, North Yorkshire YO22 4HP
| Today | See what it's worth now |
| 14 Feb 2025 | £250,000 |
| 21 May 2018 | £160,000 |
17, Runswick Avenue, Whitby, North Yorkshire YO21 3UB
| Today | See what it's worth now |
| 12 Feb 2025 | £265,000 |
| 22 Mar 2010 | £155,000 |
No other historical records.
3, Rosemount Road, Whitby, North Yorkshire YO21 1LB
| Today | See what it's worth now |
| 31 Jan 2025 | £280,000 |
No other historical records.
10, Blenheim Avenue, Whitby, North Yorkshire YO21 3HR
| Today | See what it's worth now |
| 24 Jan 2025 | £185,000 |
| 21 Jul 2017 | £162,000 |
3, Railway Cottages, Waterstead Lane, Whitby, North Yorkshire YO21 1TH


| Today | See what it's worth now |
| 24 Jan 2025 | £270,000 |
| 9 Oct 2020 | £210,000 |
29, Pannett Way, Whitby, North Yorkshire YO21 1NZ
| Today | See what it's worth now |
| 13 Jan 2025 | £270,000 |
| 29 Jun 2007 | £180,000 |
No other historical records.
1, Esk Terrace, Whitby, North Yorkshire YO21 1PA
| Today | See what it's worth now |
| 10 Jan 2025 | £425,700 |
| 11 May 2017 | £305,000 |
20, Upgang Lane, Whitby, North Yorkshire YO21 3EA
| Today | See what it's worth now |
| 9 Jan 2025 | £450,000 |
| 29 Jul 2002 | £161,500 |
No other historical records.
18, Byland Road, Whitby, North Yorkshire YO21 1JH
| Today | See what it's worth now |
| 7 Jan 2025 | £168,000 |
| 22 Mar 2013 | £116,500 |
41, Highfield Road, Whitby, North Yorkshire YO21 3LW

| Today | See what it's worth now |
| 6 Jan 2025 | £245,000 |
| 3 Jul 2018 | £205,000 |
No other historical records.
1, Elders Yard, Whitby, North Yorkshire YO21 3BY

| Today | See what it's worth now |
| 6 Jan 2025 | £210,000 |
| 21 Mar 1997 | £29,000 |
No other historical records.
7, Drake Close, Whitby, North Yorkshire YO21 1RG
| Today | See what it's worth now |
| 3 Jan 2025 | £215,000 |
| 26 May 2004 | £135,000 |
No other historical records.
30, Nightingale Drive, Whitby, North Yorkshire YO22 4QP

| Today | See what it's worth now |
| 19 Dec 2024 | £370,000 |
| 30 Jun 2017 | �£319,995 |
No other historical records.
Flat 4, 24, Crescent Avenue, Whitby, North Yorkshire YO21 3ED

| Today | See what it's worth now |
| 19 Dec 2024 | £85,000 |
| 27 Jun 2014 | £75,000 |
No other historical records.
31, Sutcliffe Court, Whitby, North Yorkshire YO21 1YH

| Today | See what it's worth now |
| 19 Dec 2024 | £165,000 |
| 21 Dec 2022 | £155,000 |
1, The Avenue, Whitby, North Yorkshire YO21 3NH
| Today | See what it's worth now |
| 18 Dec 2024 | £300,000 |
| 3 Mar 2020 | £230,000 |
No other historical records.
10, Chancel Way, Whitby, North Yorkshire YO21 3NW
| Today | See what it's worth now |
| 18 Dec 2024 | £210,000 |
| 8 Oct 2014 | £165,000 |
2, Normanby Terrace, Whitby, North Yorkshire YO21 3ES
| Today | See what it's worth now |
| 18 Dec 2024 | £490,000 |
| 12 Dec 2000 | £57,000 |
No other historical records.
Flat 12, Fairways Court, Upgang Lane, Whitby, North Yorkshire YO21 3JY
| Today | See what it's worth now |
| 18 Dec 2024 | £160,000 |
| 31 Aug 2022 | £175,000 |
7, Blenheim Avenue, Whitby, North Yorkshire YO21 3HR
| Today | See what it's worth now |
| 17 Dec 2024 | £255,000 |
| 8 Jul 2022 | £228,000 |
18, Claremont Drive, Whitby, North Yorkshire YO21 3FL

| Today | See what it's worth now |
| 16 Dec 2024 | £399,950 |
| 29 Oct 2021 | £355,000 |
No other historical records.
Flat 7, Howards Court, Upgang Lane, Whitby, North Yorkshire YO21 3JW
| Today | See what it's worth now |
| 16 Dec 2024 | £140,000 |
| 2 Apr 2003 | £91,000 |
25, The Garth, Whitby, North Yorkshire YO21 3PD

| Today | See what it's worth now |
| 13 Dec 2024 | £215,000 |
| 5 Mar 2018 | £165,000 |
No other historical records.
The Coach House, Manor Close, Whitby, North Yorkshire YO21 1HR

| Today | See what it's worth now |
| 13 Dec 2024 | £340,000 |
| 13 Apr 2007 | £267,000 |
No other historical records.
Get ready with a Mortgage in Principle
- Personalised result in just 20 minutes
- Find out how much you can borrow
- Get viewings faster with agents
- No impact on your credit score
What's your property worth?
Source Acknowledgement: © Crown copyright. England and Wales house price data is publicly available information produced by the HM Land Registry.This material was last updated on 17 April 2025. It covers the period from 1 January 1995 to 28 February 2025 and contains property transactions which have been registered during that period. Contains HM Land Registry data © Crown copyright and database right 2025. This data is licensed under the Open Government Licence v3.0.
Disclaimer: Rightmove.co.uk provides this HM Land Registry data "as is". The burden for fitness of the data relies completely with the user and is provided for informational purposes only. No warranty, express or implied, is given relating to the accuracy of content of the HM Land Registry data and Rightmove does not accept any liability for error or omission. If you have found an error with the data or need further information please contact HM Land Registry.
Permitted Use: Viewers of this Information are granted permission to access this Crown copyright material and to download it onto electronic, magnetic, optical or similar storage media provided that such activities are for private research, study or in-house use only. Any other use of the material requires the formal written permission of Land Registry which can be requested from us, and is subject to an additional licence and associated charge.
Map data ©OpenStreetMap contributors.
Rightmove takes no liability for your use of, or reliance on, Rightmove's Instant Valuation due to the limitations of our tracking tool listed here. Use of this tool is taken entirely at your own risk. All rights reserved.