
House Prices in Urlay Nook
House prices in Urlay Nook have an overall average of £257,385 over the last year.
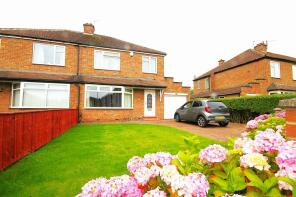
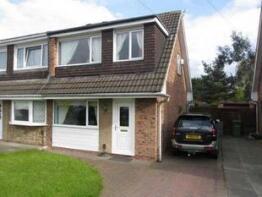
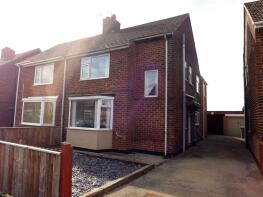
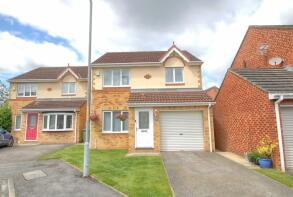
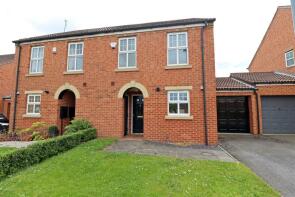
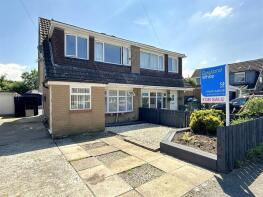
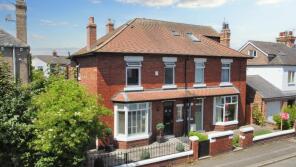
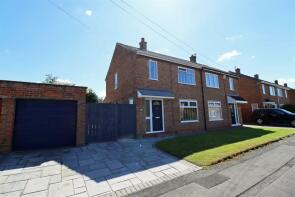
The majority of properties sold in Urlay Nook during the last year were semi-detached properties, selling for an average price of £236,707. Detached properties sold for an average of £328,423, with terraced properties fetching £217,313.
Overall, the historical sold prices in Urlay Nook over the last year were 11% down on the previous year and 5% down on the 2022 peak of £269,902.
Properties Sold
33, Greenfield Drive, Eaglescliffe, Stockton-on-tees TS16 0HB
| Today | See what it's worth now |
| 6 Feb 2025 | £165,000 |
| 15 Jul 2005 | £126,000 |
No other historical records.
2, Broomfield Avenue, Eaglescliffe, Stockton-on-tees TS16 0ET

| Today | See what it's worth now |
| 4 Feb 2025 | £245,000 |
| 29 Jun 2022 | £170,000 |
No other historical records.
9, Farnham Close, Eaglescliffe, Stockton-on-tees TS16 0NF
| Today | See what it's worth now |
| 31 Jan 2025 | £212,000 |
| 12 Jan 2015 | £150,000 |
No other historical records.
Flat 5, 658, Yarm Road, Eaglescliffe, Stockton-on-tees TS16 0DP


| Today | See what it's worth now |
| 31 Jan 2025 | £85,000 |
| 30 Aug 2013 | £87,000 |
No other historical records.
61, Emsworth Drive, Eaglescliffe, Stockton-on-tees TS16 0NP
| Today | See what it's worth now |
| 24 Jan 2025 | £189,500 |
No other historical records.
1, Black Bull Wynd, Eaglescliffe, Stockton-on-tees TS16 0GN

| Today | See what it's worth now |
| 20 Jan 2025 | £445,000 |
| 22 May 2009 | £300,000 |
3, Skiddaw Close, Eaglescliffe, Stockton-on-tees TS16 0HU
| Today | See what it's worth now |
| 17 Jan 2025 | £158,000 |
| 30 Apr 1999 | £45,000 |
No other historical records.
5, Laburnum Road, Eaglescliffe, Stockton-on-tees TS16 0AW

| Today | See what it's worth now |
| 13 Jan 2025 | £116,000 |
| 6 Apr 2021 | £102,500 |
29, Seymour Drive, Eaglescliffe, Stockton-on-tees TS16 0LG
| Today | See what it's worth now |
| 13 Jan 2025 | £195,000 |
| 10 Dec 2012 | £137,000 |
2, Diligence Way, Eaglescliffe, Stockton-on-tees TS16 0RR
| Today | See what it's worth now |
| 18 Dec 2024 | £365,000 |
| 6 Aug 2018 | £270,000 |
5, Hunters Green, Eaglescliffe, Stockton-on-tees TS16 0NY

| Today | See what it's worth now |
| 16 Dec 2024 | £276,995 |
| 11 Mar 2005 | £191,995 |
No other historical records.
11, Urlay Nook Road, Eaglescliffe, Stockton-on-tees TS16 0LU
| Today | See what it's worth now |
| 11 Dec 2024 | £219,950 |
No other historical records.
7, Farnham Close, Eaglescliffe, Stockton-on-tees TS16 0NF
| Today | See what it's worth now |
| 11 Dec 2024 | £197,000 |
No other historical records.
1, Sycamore Road, Eaglescliffe, Stockton-on-tees TS16 0AZ

| Today | See what it's worth now |
| 6 Dec 2024 | £150,000 |
No other historical records.
9, Highfield Drive, Eaglescliffe, Stockton-on-tees TS16 0DL
| Today | See what it's worth now |
| 4 Dec 2024 | £248,000 |
| 9 Dec 2002 | �£124,000 |
No other historical records.
30, Whinfell Avenue, Eaglescliffe, Stockton-on-tees TS16 0HY
| Today | See what it's worth now |
| 22 Nov 2024 | £100,000 |
| 28 Feb 2003 | £85,000 |
No other historical records.
44, Myrtle Road, Eaglescliffe, Stockton-on-tees TS16 0AP
| Today | See what it's worth now |
| 22 Nov 2024 | £165,000 |
| 14 Mar 2014 | £134,325 |
14, Black Diamond Way, Eaglescliffe, Stockton-on-tees TS16 0SE
| Today | See what it's worth now |
| 15 Nov 2024 | £225,000 |
| 29 Jun 2001 | £85,950 |
No other historical records.
5, Lartington Way, Eaglescliffe, Stockton-on-tees TS16 0JQ
| Today | See what it's worth now |
| 8 Nov 2024 | £186,200 |
| 14 Jun 2013 | £141,000 |
38, Burnmoor Drive, Eaglescliffe, Stockton-on-tees TS16 0HZ
| Today | See what it's worth now |
| 4 Nov 2024 | £151,500 |
No other historical records.
36, Pinewood Road, Eaglescliffe, Stockton-on-tees TS16 0AJ
| Today | See what it's worth now |
| 4 Nov 2024 | £260,000 |
| 14 Aug 2015 | £155,000 |
No other historical records.
13, Wear Crescent, Eaglescliffe, Stockton-on-tees TS16 0JP
| Today | See what it's worth now |
| 4 Nov 2024 | £165,000 |
| 30 Mar 2012 | £110,000 |
No other historical records.
88, Mayfield Crescent, Eaglescliffe, Stockton-on-tees TS16 0NN
| Today | See what it's worth now |
| 29 Oct 2024 | £207,000 |
| 16 Jul 2001 | £72,500 |
No other historical records.
54, Meadowfield Drive, Eaglescliffe, Stockton-on-tees TS16 0HH
| Today | See what it's worth now |
| 29 Oct 2024 | £260,000 |
| 10 Sep 2021 | £240,000 |
35, Emsworth Drive, Eaglescliffe, Stockton-on-tees TS16 0NR
| Today | See what it's worth now |
| 25 Oct 2024 | £245,000 |
| 8 Jan 2014 | £155,000 |
No other historical records.
Get ready with a Mortgage in Principle
- Personalised result in just 20 minutes
- Find out how much you can borrow
- Get viewings faster with agents
- No impact on your credit score
What's your property worth?
Source Acknowledgement: © Crown copyright. England and Wales house price data is publicly available information produced by the HM Land Registry.This material was last updated on 17 April 2025. It covers the period from 1 January 1995 to 28 February 2025 and contains property transactions which have been registered during that period. Contains HM Land Registry data © Crown copyright and database right 2025. This data is licensed under the Open Government Licence v3.0.
Disclaimer: Rightmove.co.uk provides this HM Land Registry data "as is". The burden for fitness of the data relies completely with the user and is provided for informational purposes only. No warranty, express or implied, is given relating to the accuracy of content of the HM Land Registry data and Rightmove does not accept any liability for error or omission. If you have found an error with the data or need further information please contact HM Land Registry.
Permitted Use: Viewers of this Information are granted permission to access this Crown copyright material and to download it onto electronic, magnetic, optical or similar storage media provided that such activities are for private research, study or in-house use only. Any other use of the material requires the formal written permission of Land Registry which can be requested from us, and is subject to an additional licence and associated charge.
Map data ©OpenStreetMap contributors.
Rightmove takes no liability for your use of, or reliance on, Rightmove's Instant Valuation due to the limitations of our tracking tool listed here. Use of this tool is taken entirely at your own risk. All rights reserved.