
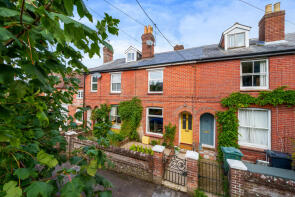
House Prices in Twyford
House prices in Twyford have an overall average of £661,370 over the last year.
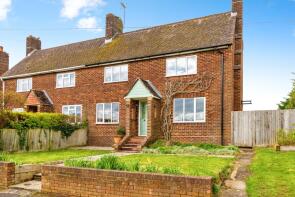
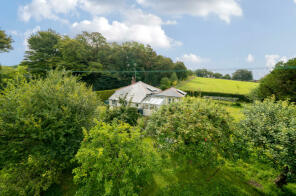
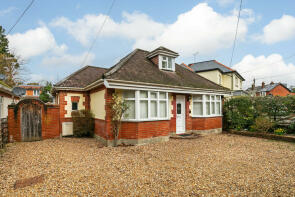
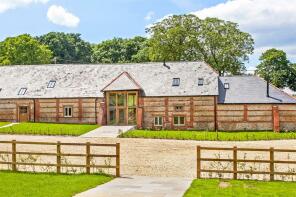
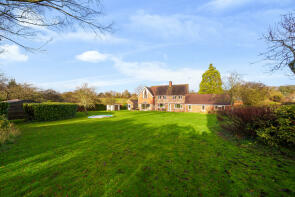
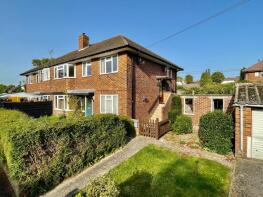
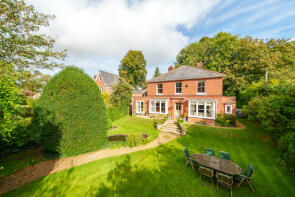
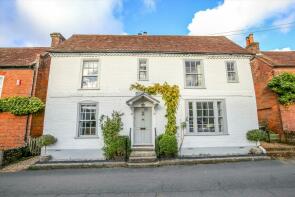
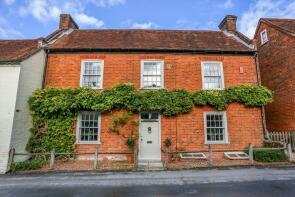
The majority of properties sold in Twyford during the last year were detached properties, selling for an average price of £848,333. Terraced properties sold for an average of £558,884, with semi-detached properties fetching £620,625.
Overall, the historical sold prices in Twyford over the last year were 3% down on the previous year and 42% down on the 2021 peak of £1,145,000.
Properties Sold
14, Waterhouse Close, Twyford, Winchester, Hampshire SO21 1PN
| Today | See what it's worth now |
| 19 Dec 2024 | £340,000 |
| 19 Aug 2020 | £311,500 |
5, The Drove, Twyford, Winchester, Hampshire SO21 1QL
| Today | See what it's worth now |
| 14 Nov 2024 | £648,420 |
| 25 Sep 2017 | £500,000 |
No other historical records.
6, Manor Flats, Manor Road, Twyford, Winchester, Hampshire SO21 1RJ


| Today | See what it's worth now |
| 24 Oct 2024 | £215,000 |
| 14 Aug 2020 | £180,000 |
No other historical records.
5, School Road, Twyford, Winchester, Hampshire SO21 1QQ
| Today | See what it's worth now |
| 23 Oct 2024 | £470,000 |
| 6 Mar 2019 | £290,000 |
No other historical records.
7, School Road, Twyford, Winchester, Hampshire SO21 1QQ
| Today | See what it's worth now |
| 18 Oct 2024 | £486,000 |
| 2 Jun 2014 | £365,000 |
Maple Cottage, Drove Close, Twyford, Winchester, Hampshire SO21 1QN

| Today | See what it's worth now |
| 18 Oct 2024 | £650,000 |
| 28 Oct 2004 | £450,000 |
No other historical records.
Twyford Cottage, High Street, Twyford, Winchester, Hampshire SO21 1RF

| Today | See what it's worth now |
| 11 Oct 2024 | £865,000 |
| 2 May 2014 | £525,000 |
10, Churchfields, Twyford, Winchester, Hampshire SO21 1NN
| Today | See what it's worth now |
| 2 Oct 2024 | £492,500 |
| 27 Jul 2016 | £405,000 |
Pax Lodge, Coxs Hill, Twyford, Winchester, Hampshire SO21 1PQ
| Today | See what it's worth now |
| 13 Sep 2024 | £620,000 |
No other historical records.
Linden, Finches Lane, Twyford, Winchester, Hampshire SO21 1QB
| Today | See what it's worth now |
| 13 Sep 2024 | £445,000 |
| 8 Sep 2017 | £485,000 |
Barn House, Manor Barns, Hazeley Road, Twyford, Winchester, Hampshire SO21 1QA
| Today | See what it's worth now |
| 14 Jun 2024 | £850,000 |
| 12 Feb 2018 | £730,000 |
No other historical records.
8, Churchfields, Twyford, Winchester, Hampshire SO21 1NN
| Today | See what it's worth now |
| 23 May 2024 | £490,000 |
| 4 Feb 2016 | £358,000 |
Home Mead, High Street, Twyford, Winchester, Hampshire SO21 1NW
| Today | See what it's worth now |
| 17 May 2024 | £1,200,000 |
| 25 Jun 2021 | £1,300,000 |
5, Manor Farm Green, Twyford, Winchester, Hampshire SO21 1RA
| Today | See what it's worth now |
| 2 May 2024 | £750,000 |
| 1 Oct 2004 | £347,500 |
Pemberley, High Street, Twyford, Winchester, Hampshire SO21 1NP
| Today | See what it's worth now |
| 1 May 2024 | £750,000 |
| 20 Jan 2004 | £335,000 |
No other historical records.
Treetops, Hazeley Road, Twyford, Winchester, Hampshire SO21 1PZ
| Today | See what it's worth now |
| 17 Apr 2024 | £1,310,000 |
No other historical records.
5a, Shipley Road, Twyford, Winchester, Hampshire SO21 1PA
| Today | See what it's worth now |
| 15 Mar 2024 | £267,840 |
No other historical records.
St. Marys, The Avenue, Twyford, Winchester, Hampshire SO21 1NJ
| Today | See what it's worth now |
| 13 Mar 2024 | £1,170,000 |
| 31 Aug 2004 | £633,500 |
The White House, Queen Street, Twyford, Winchester, Hampshire SO21 1QG
| Today | See what it's worth now |
| 16 Feb 2024 | £1,190,011 |
| 15 Jan 2010 | £671,000 |
6, Park Lane, Twyford, Winchester, Hampshire SO21 1QT
| Today | See what it's worth now |
| 16 Feb 2024 | £430,000 |
| 10 Oct 2018 | £375,000 |
The Old Malt House, Queen Street, Twyford, Winchester, Hampshire SO21 1QG
| Today | See what it's worth now |
| 16 Feb 2024 | £1,580,000 |
| 15 Sep 2005 | £725,000 |
No other historical records.
10, The Crescent, Twyford, Winchester, Hampshire SO21 1NL
| Today | See what it's worth now |
| 29 Jan 2024 | £825,000 |
| 26 Sep 2014 | £685,000 |
3, Hockley Cottages, Twyford, Winchester, Hampshire SO21 1PJ

| Today | See what it's worth now |
| 12 Jan 2024 | £480,000 |
| 15 Dec 2017 | £460,000 |
No other historical records.
Mayfield, High Street, Twyford, Winchester, Hampshire SO21 1RG
| Today | See what it's worth now |
| 20 Dec 2023 | £720,000 |
| 11 Jan 2018 | £562,000 |
28, Churchfields, Twyford, Winchester, Hampshire SO21 1NN
| Today | See what it's worth now |
| 1 Dec 2023 | £850,000 |
| 31 Mar 2016 | £265,000 |
No other historical records.
Get ready with a Mortgage in Principle
- Personalised result in just 20 minutes
- Find out how much you can borrow
- Get viewings faster with agents
- No impact on your credit score
What's your property worth?
Source Acknowledgement: © Crown copyright. England and Wales house price data is publicly available information produced by the HM Land Registry.This material was last updated on 17 April 2025. It covers the period from 1 January 1995 to 28 February 2025 and contains property transactions which have been registered during that period. Contains HM Land Registry data © Crown copyright and database right 2025. This data is licensed under the Open Government Licence v3.0.
Disclaimer: Rightmove.co.uk provides this HM Land Registry data "as is". The burden for fitness of the data relies completely with the user and is provided for informational purposes only. No warranty, express or implied, is given relating to the accuracy of content of the HM Land Registry data and Rightmove does not accept any liability for error or omission. If you have found an error with the data or need further information please contact HM Land Registry.
Permitted Use: Viewers of this Information are granted permission to access this Crown copyright material and to download it onto electronic, magnetic, optical or similar storage media provided that such activities are for private research, study or in-house use only. Any other use of the material requires the formal written permission of Land Registry which can be requested from us, and is subject to an additional licence and associated charge.
Map data ©OpenStreetMap contributors.
Rightmove takes no liability for your use of, or reliance on, Rightmove's Instant Valuation due to the limitations of our tracking tool listed here. Use of this tool is taken entirely at your own risk. All rights reserved.