
House Prices in TN8
House prices in TN8 have an overall average of £512,105 over the last year.
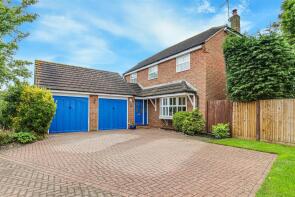
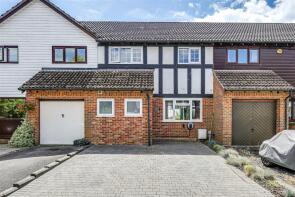
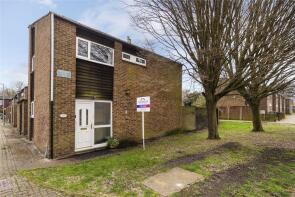
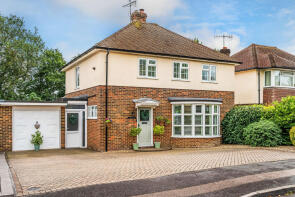
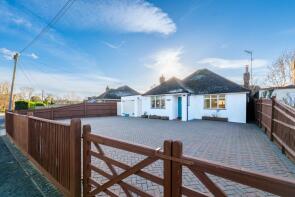
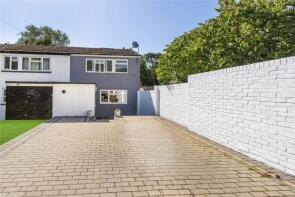
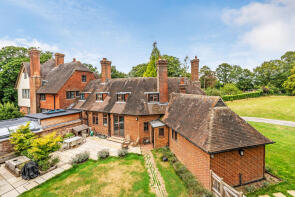
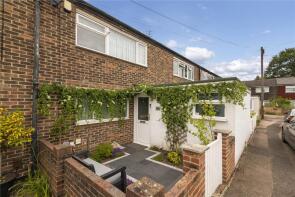
The majority of properties sold in TN8 during the last year were terraced properties, selling for an average price of £410,461. Semi-detached properties sold for an average of £520,444, with detached properties fetching £726,172.
Overall, the historical sold prices in TN8 over the last year were 4% down on the previous year and 8% down on the 2022 peak of £558,139.
Properties Sold
1, Lodgewood Cottages, Hever Road, Hever, Edenbridge, Kent TN8 7NP


| Today | See what it's worth now |
| 18 Feb 2025 | £845,000 |
No other historical records.
24, Westways, Edenbridge, Kent TN8 6AA
| Today | See what it's worth now |
| 17 Feb 2025 | £547,500 |
| 14 Aug 2017 | £482,000 |
9, Clark Close, Edenbridge, Kent TN8 6FN
| Today | See what it's worth now |
| 6 Feb 2025 | £560,000 |
| 15 Feb 2023 | £500,000 |
No other historical records.
1, Carpenters Cottage, Main Road, Edenbridge, Kent TN8 6SN

| Today | See what it's worth now |
| 5 Feb 2025 | £585,000 |
| 21 Oct 2021 | £675,000 |
Flat 16, The Albions, Main Road, Edenbridge, Kent TN8 6HR
| Today | See what it's worth now |
| 31 Jan 2025 | £210,000 |
| 24 Sep 2004 | £139,000 |
10, The Row, Edenbridge, Kent TN8 6HX

| Today | See what it's worth now |
| 30 Jan 2025 | £290,750 |
No other historical records.
Anvil Cottage, Forge Croft, Edenbridge, Kent TN8 5BW
| Today | See what it's worth now |
| 30 Jan 2025 | £325,000 |
| 7 Apr 2000 | £152,000 |
No other historical records.
4, Ashbys Close, Edenbridge, Kent TN8 5ET
| Today | See what it's worth now |
| 29 Jan 2025 | £820,000 |
| 11 Jan 2019 | £675,000 |
8, Lucilina Drive, Edenbridge, Kent TN8 5HF
| Today | See what it's worth now |
| 29 Jan 2025 | £442,000 |
| 24 Aug 2018 | £350,000 |
1, Harrow Close, Edenbridge, Kent TN8 6DT
| Today | See what it's worth now |
| 24 Jan 2025 | £247,000 |
No other historical records.
13, Meadow Lane, Edenbridge, Kent TN8 6HT
| Today | See what it's worth now |
| 20 Jan 2025 | £731,000 |
| 1 Jul 2020 | £576,300 |
No other historical records.
Greenways, Crouch House Road, Edenbridge, Kent TN8 5EE
| Today | See what it's worth now |
| 13 Jan 2025 | �£525,000 |
No other historical records.
2, Hawthorn Close, Edenbridge, Kent TN8 5JX
| Today | See what it's worth now |
| 13 Jan 2025 | £345,000 |
| 28 Nov 2016 | £270,000 |
3, Stangrove Court, Stangrove Road, Edenbridge, Kent TN8 5HR

| Today | See what it's worth now |
| 8 Jan 2025 | £255,000 |
| 15 Aug 2008 | £150,000 |
No other historical records.
How Green East, How Green Lane, Hever, Edenbridge, Kent TN8 7NN
| Today | See what it's worth now |
| 7 Jan 2025 | £905,000 |
| 17 Aug 2021 | £899,950 |
6, Headley Court, Station Approach, Edenbridge, Kent TN8 5LS

| Today | See what it's worth now |
| 3 Jan 2025 | £246,750 |
| 17 Aug 2016 | £192,000 |
No other historical records.
94, Cedar Drive, Edenbridge, Kent TN8 5JT
| Today | See what it's worth now |
| 19 Dec 2024 | £330,000 |
| 4 Sep 2020 | £280,000 |
32, Chantlers Mead, Cowden, Edenbridge, Kent TN8 7HU
| Today | See what it's worth now |
| 12 Dec 2024 | £405,000 |
| 4 Sep 2020 | £305,000 |
3, High Street, Cowden, Edenbridge, Kent TN8 7JQ

| Today | See what it's worth now |
| 6 Dec 2024 | £385,000 |
| 29 Apr 2010 | £275,000 |
46, Hailwood Drive, Edenbridge, Kent TN8 6FP

| Today | See what it's worth now |
| 6 Dec 2024 | £477,500 |
| 25 Sep 2020 | £435,000 |
No other historical records.
1, Prinkham Cottages, Moor Lane, Marsh Green, Edenbridge, Surrey TN8 5QT

| Today | See what it's worth now |
| 29 Nov 2024 | £460,000 |
No other historical records.
Open View, How Green Lane, Hever, Edenbridge, Kent TN8 7PS
| Today | See what it's worth now |
| 27 Nov 2024 | £861,500 |
| 20 Dec 2007 | £642,500 |
No other historical records.
2, Foresters Cottages, Edenbridge, Kent TN8 5DE

| Today | See what it's worth now |
| 27 Nov 2024 | £600,000 |
| 23 Jan 2015 | £340,000 |
16, The Row, Edenbridge, Kent TN8 6HX
| Today | See what it's worth now |
| 27 Nov 2024 | £312,000 |
| 28 Jan 2022 | £280,000 |
No other historical records.
10, Smithyfield, Edenbridge, Kent TN8 6DG
| Today | See what it's worth now |
| 25 Nov 2024 | £400,000 |
| 11 Jan 1999 | £73,500 |
No other historical records.
Find out how much your property is worth
The following agents can provide you with a free, no-obligation valuation. Simply select the ones you'd like to hear from.
Sponsored
All featured agents have paid a fee to promote their valuation expertise.

LeGrys Edenbridge
Edenbridge

Yopa
Nationwide

Robert Leech
Lingfield
Get ready with a Mortgage in Principle
- Personalised result in just 20 minutes
- Find out how much you can borrow
- Get viewings faster with agents
- No impact on your credit score
What's your property worth?
Source Acknowledgement: © Crown copyright. England and Wales house price data is publicly available information produced by the HM Land Registry.This material was last updated on 17 April 2025. It covers the period from 1 January 1995 to 28 February 2025 and contains property transactions which have been registered during that period. Contains HM Land Registry data © Crown copyright and database right 2025. This data is licensed under the Open Government Licence v3.0.
Disclaimer: Rightmove.co.uk provides this HM Land Registry data "as is". The burden for fitness of the data relies completely with the user and is provided for informational purposes only. No warranty, express or implied, is given relating to the accuracy of content of the HM Land Registry data and Rightmove does not accept any liability for error or omission. If you have found an error with the data or need further information please contact HM Land Registry.
Permitted Use: Viewers of this Information are granted permission to access this Crown copyright material and to download it onto electronic, magnetic, optical or similar storage media provided that such activities are for private research, study or in-house use only. Any other use of the material requires the formal written permission of Land Registry which can be requested from us, and is subject to an additional licence and associated charge.
Map data ©OpenStreetMap contributors.
Rightmove takes no liability for your use of, or reliance on, Rightmove's Instant Valuation due to the limitations of our tracking tool listed here. Use of this tool is taken entirely at your own risk. All rights reserved.