
House Prices in SE23
House prices in SE23 have an overall average of £611,073 over the last year.
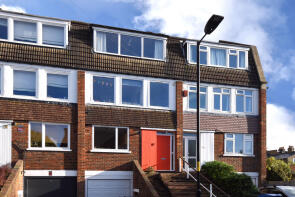
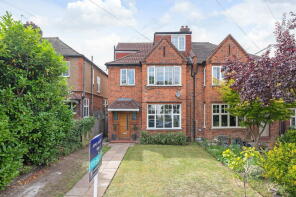
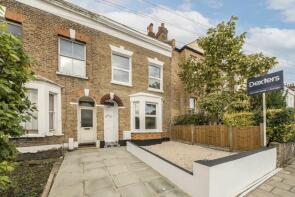
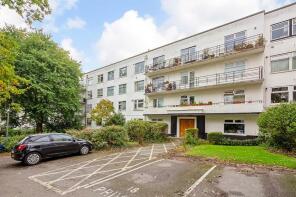
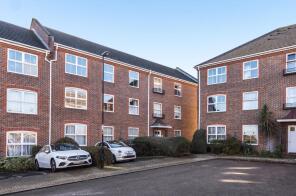
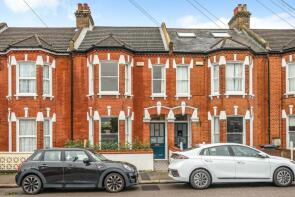
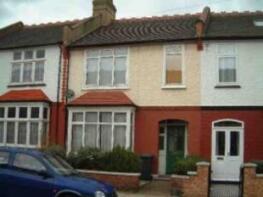
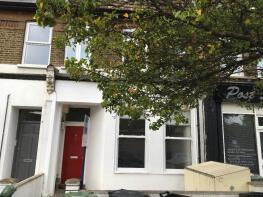
The majority of properties sold in SE23 during the last year were flats, selling for an average price of £424,180. Terraced properties sold for an average of £754,611, with semi-detached properties fetching £1,090,265.
Overall, the historical sold prices in SE23 over the last year were 10% up on the previous year and similar to the 2022 peak of £606,550.
Properties Sold
11, Buckstone Close, London, Greater London SE23 3QT
| Today | See what it's worth now |
| 21 Feb 2025 | £928,000 |
| 4 Aug 2017 | £657,500 |
No other historical records.
Flat 12, 174, Devonshire Road, London, Greater London SE23 3SZ


| Today | See what it's worth now |
| 14 Feb 2025 | £380,000 |
| 27 Mar 2020 | £320,000 |
29, Lowther Hill, London, Greater London SE23 1PZ
| Today | See what it's worth now |
| 13 Feb 2025 | £1,600,000 |
| 16 Aug 2000 | £388,000 |
No other historical records.
Flat A, 139, Devonshire Road, London, Greater London SE23 3LZ

| Today | See what it's worth now |
| 12 Feb 2025 | £360,000 |
| 20 Oct 2020 | £335,000 |
Flat 7, Sunset Heights, 77, St German's Road, London, Greater London SE23 1RY

| Today | See what it's worth now |
| 11 Feb 2025 | £350,000 |
| 16 Apr 2013 | £210,000 |
16, Perry Rise, London, Greater London SE23 2QL
| Today | See what it's worth now |
| 11 Feb 2025 | £1,035,000 |
| 3 Apr 2012 | £475,000 |
No other historical records.
61, Stanstead Road, Forest Hill, London, Greater London SE23 1HG
| Today | See what it's worth now |
| 7 Feb 2025 | £535,000 |
| 18 Jan 2012 | £295,000 |
Flat 3, Upland Court, 33, London Road, London, Greater London SE23 3TX

| Today | See what it's worth now |
| 7 Feb 2025 | £310,000 |
| 31 Oct 2014 | £290,000 |
136a, Devonshire Road, London, Greater London SE23 3SZ
| Today | See what it's worth now |
| 7 Feb 2025 | £491,000 |
| 13 Jul 2012 | £294,700 |
No other historical records.
68, Colfe Road, London, Greater London SE23 2ER

| Today | See what it's worth now |
| 5 Feb 2025 | £815,000 |
No other historical records.
15, Beadnell Road, London, Greater London SE23 1AA
| Today | See what it's worth now |
| 31 Jan 2025 | £674,600 |
| 10 May 2024 | £465,000 |
No other historical records.
1, Talmage Close, London, Greater London SE23 3AE

| Today | See what it's worth now |
| 31 Jan 2025 | £660,000 |
| 29 Jan 2015 | £384,600 |
No other historical records.
Flat 3, 6, Church Rise, London, Greater London SE23 2UD

| Today | See what it's worth now |
| 31 Jan 2025 | £402,000 |
| 4 Oct 2013 | £295,000 |
No other historical records.
15, Grizedale Terrace, London, Greater London SE23 3XF
| Today | See what it's worth now |
| 31 Jan 2025 | £667,000 |
| 24 Feb 2016 | £525,000 |
Flat 21, Forest Croft, Taymount Rise, Forest Hill, London, Greater London SE23 3UN
| Today | See what it's worth now |
| 31 Jan 2025 | £311,500 |
| 6 Mar 2014 | �£250,000 |
105, Perry Vale, London, Greater London SE23 2NJ
| Today | See what it's worth now |
| 31 Jan 2025 | £625,000 |
| 14 Aug 2020 | £480,000 |
24, Paxton Road, London, Greater London SE23 2QG
| Today | See what it's worth now |
| 31 Jan 2025 | £248,000 |
| 22 Aug 2018 | £258,000 |
33, Gabriel Street, London, Greater London SE23 1DW
| Today | See what it's worth now |
| 30 Jan 2025 | £986,000 |
| 19 Dec 2018 | £847,000 |
15, Woodcombe Crescent, London, Greater London SE23 3BG

| Today | See what it's worth now |
| 30 Jan 2025 | £1,062,500 |
| 21 Jul 2006 | £401,500 |
12, Riseldine Road, London, Greater London SE23 1JU
| Today | See what it's worth now |
| 30 Jan 2025 | £950,000 |
| 8 Jan 2021 | £755,000 |
13a, Stanstead Road, Forest Hill, London, Greater London SE23 1HG
| Today | See what it's worth now |
| 29 Jan 2025 | £365,000 |
| 6 Jun 2023 | £346,000 |
Flat 1, 7, Taymount Rise, Forest Hill, London, Greater London SE23 3UG

| Today | See what it's worth now |
| 27 Jan 2025 | £350,000 |
| 1 Dec 2017 | £322,900 |
No other historical records.
234, Perry Rise, London, Greater London SE23 2QT
| Today | See what it's worth now |
| 27 Jan 2025 | £591,000 |
| 11 Aug 2017 | £490,000 |
6, Rojack Road, London, Greater London SE23 2DF
| Today | See what it's worth now |
| 27 Jan 2025 | £860,000 |
| 3 Oct 2011 | £377,000 |
Flat 3, 70a, Honor Oak Road, London, Greater London SE23 3RR

| Today | See what it's worth now |
| 24 Jan 2025 | £255,000 |
No other historical records.
Find out how much your property is worth
The following agents can provide you with a free, no-obligation valuation. Simply select the ones you'd like to hear from.
Sponsored
All featured agents have paid a fee to promote their valuation expertise.

Hunters
Forest Hill

Foxtons
Dulwich

Pedder
Forest Hill

Pickwick Estates
Honor Oak

Winkworth
Forest Hill

Acorn
Forest Hill
Get ready with a Mortgage in Principle
- Personalised result in just 20 minutes
- Find out how much you can borrow
- Get viewings faster with agents
- No impact on your credit score
What's your property worth?
Source Acknowledgement: © Crown copyright. England and Wales house price data is publicly available information produced by the HM Land Registry.This material was last updated on 17 April 2025. It covers the period from 1 January 1995 to 28 February 2025 and contains property transactions which have been registered during that period. Contains HM Land Registry data © Crown copyright and database right 2025. This data is licensed under the Open Government Licence v3.0.
Disclaimer: Rightmove.co.uk provides this HM Land Registry data "as is". The burden for fitness of the data relies completely with the user and is provided for informational purposes only. No warranty, express or implied, is given relating to the accuracy of content of the HM Land Registry data and Rightmove does not accept any liability for error or omission. If you have found an error with the data or need further information please contact HM Land Registry.
Permitted Use: Viewers of this Information are granted permission to access this Crown copyright material and to download it onto electronic, magnetic, optical or similar storage media provided that such activities are for private research, study or in-house use only. Any other use of the material requires the formal written permission of Land Registry which can be requested from us, and is subject to an additional licence and associated charge.
Map data ©OpenStreetMap contributors.
Rightmove takes no liability for your use of, or reliance on, Rightmove's Instant Valuation due to the limitations of our tracking tool listed here. Use of this tool is taken entirely at your own risk. All rights reserved.