
House Prices in S5
House prices in S5 have an overall average of £155,131 over the last year.
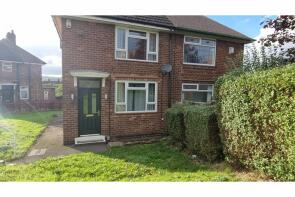
The majority of properties sold in S5 during the last year were semi-detached properties, selling for an average price of £160,520. Terraced properties sold for an average of £134,986, with detached properties fetching £246,562.
Overall, the historical sold prices in S5 over the last year were 5% up on the previous year and 6% up on the 2022 peak of £146,887.
Properties Sold
34, Ellerton Road, Sheffield, South Yorkshire S5 6UG


| Today | See what it's worth now |
| 20 Feb 2025 | £90,000 |
| 18 Oct 2002 | £30,000 |
No other historical records.
392, Sicey Avenue, Sheffield, South Yorkshire S5 0EN
| Today | See what it's worth now |
| 13 Feb 2025 | £140,000 |
| 13 Jun 2016 | £75,000 |
No other historical records.
2, Haven Hill Road, Sheffield, South Yorkshire S5 9BS

| Today | See what it's worth now |
| 10 Feb 2025 | £176,000 |
| 15 Dec 2023 | £155,000 |
55, Dugdale Road, Sheffield, South Yorkshire S5 9NY
| Today | See what it's worth now |
| 7 Feb 2025 | £145,000 |
No other historical records.
118, Bellhouse Road, Sheffield, South Yorkshire S5 6HN
| Today | See what it's worth now |
| 7 Feb 2025 | £128,000 |
| 9 Jun 2017 | £85,500 |
No other historical records.
91, Hatfield House Lane, Sheffield, South Yorkshire S5 6HX
| Today | See what it's worth now |
| 7 Feb 2025 | £140,000 |
| 3 Jun 2014 | £93,900 |
358, Firth Park Road, Sheffield, South Yorkshire S5 6HG
| Today | See what it's worth now |
| 5 Feb 2025 | £185,000 |
| 26 Oct 1997 | £37,000 |
No other historical records.
25, Halliwell Crescent, Sheffield, South Yorkshire S5 8LX
| Today | See what it's worth now |
| 3 Feb 2025 | £122,000 |
| 8 Mar 2019 | £76,000 |
20, Tunwell Greave, Sheffield, South Yorkshire S5 9GE
| Today | See what it's worth now |
| 31 Jan 2025 | £190,000 |
| 13 Aug 2021 | £125,000 |
No other historical records.
44, Elmfield Avenue, Sheffield, South Yorkshire S5 7TF
| Today | See what it's worth now |
| 31 Jan 2025 | £195,000 |
No other historical records.
85, Rokeby Road, Sheffield, South Yorkshire S5 9FX
| Today | See what it's worth now |
| 31 Jan 2025 | £205,000 |
| 17 Jun 2010 | £90,000 |
21, Orchard Close, Sheffield, South Yorkshire S5 9GJ
| Today | See what it's worth now |
| 29 Jan 2025 | £233,000 |
| 11 Jun 2018 | £140,000 |
No other historical records.
20, Crowder Close, Sheffield, South Yorkshire S5 7NW
| Today | See what it's worth now |
| 24 Jan 2025 | £147,000 |
No other historical records.
90, Moonshine Lane, Sheffield, South Yorkshire S5 8RF
| Today | See what it's worth now |
| 24 Jan 2025 | £220,000 |
| 1 Feb 2018 | £120,000 |
155, Penrith Road, Sheffield, South Yorkshire S5 8TZ
| Today | See what it's worth now |
| 23 Jan 2025 | £111,000 |
No other historical records.
6, Deep Lane, Sheffield, South Yorkshire S5 0DS
| Today | See what it's worth now |
| 20 Jan 2025 | £140,000 |
| 22 Sep 2017 | £85,000 |
No other historical records.
14, Rokeby Road, Sheffield, South Yorkshire S5 9FU
| Today | See what it's worth now |
| 17 Jan 2025 | £221,000 |
| 3 Aug 2018 | £125,000 |
22, Falstaff Road, Sheffield, South Yorkshire S5 8DF

| Today | See what it's worth now |
| 17 Jan 2025 | £180,000 |
| 5 Aug 2013 | £99,995 |
No other historical records.
125, Musgrave Road, Sheffield, South Yorkshire S5 8WS
| Today | See what it's worth now |
| 10 Jan 2025 | £100,000 |
No other historical records.
2, Dryden Drive, Sheffield, South Yorkshire S5 8HL
| Today | See what it's worth now |
| 6 Jan 2025 | £132,000 |
No other historical records.
41, Crowder Road, Sheffield, South Yorkshire S5 7PJ
| Today | See what it's worth now |
| 3 Jan 2025 | £192,000 |
No other historical records.
23, Dickinson Road, Sheffield, South Yorkshire S5 0HB
| Today | See what it's worth now |
| 3 Jan 2025 | £125,000 |
| 15 Sep 2005 | £58,000 |
No other historical records.
48, Wheldrake Road, Sheffield, South Yorkshire S5 6UD
| Today | See what it's worth now |
| 3 Jan 2025 | £89,500 |
| 24 Jun 2006 | £79,100 |
32, Sycamore House Road, Sheffield, South Yorkshire S5 0UB
| Today | See what it's worth now |
| 20 Dec 2024 | £139,500 |
No other historical records.
130, Bellhouse Road, Sheffield, South Yorkshire S5 6HN
| Today | See what it's worth now |
| 20 Dec 2024 | £110,000 |
| 21 Aug 1995 | £17,000 |
No other historical records.
Find out how much your property is worth
The following agents can provide you with a free, no-obligation valuation. Simply select the ones you'd like to hear from.
Sponsored
All featured agents have paid a fee to promote their valuation expertise.

Crucible Homes
Chapeltown

Blundells
Chapeltown
William H. Brown
Bannercross

Your Move
Chapeltown

Haybrook
Hillsborough

Saxton Mee
Hillsborough
Get ready with a Mortgage in Principle
- Personalised result in just 20 minutes
- Find out how much you can borrow
- Get viewings faster with agents
- No impact on your credit score
What's your property worth?
Source Acknowledgement: © Crown copyright. England and Wales house price data is publicly available information produced by the HM Land Registry.This material was last updated on 17 April 2025. It covers the period from 1 January 1995 to 28 February 2025 and contains property transactions which have been registered during that period. Contains HM Land Registry data © Crown copyright and database right 2025. This data is licensed under the Open Government Licence v3.0.
Disclaimer: Rightmove.co.uk provides this HM Land Registry data "as is". The burden for fitness of the data relies completely with the user and is provided for informational purposes only. No warranty, express or implied, is given relating to the accuracy of content of the HM Land Registry data and Rightmove does not accept any liability for error or omission. If you have found an error with the data or need further information please contact HM Land Registry.
Permitted Use: Viewers of this Information are granted permission to access this Crown copyright material and to download it onto electronic, magnetic, optical or similar storage media provided that such activities are for private research, study or in-house use only. Any other use of the material requires the formal written permission of Land Registry which can be requested from us, and is subject to an additional licence and associated charge.
Map data ©OpenStreetMap contributors.
Rightmove takes no liability for your use of, or reliance on, Rightmove's Instant Valuation due to the limitations of our tracking tool listed here. Use of this tool is taken entirely at your own risk. All rights reserved.