
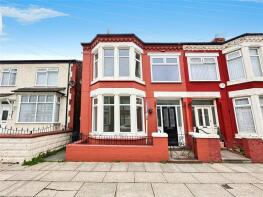
House Prices in L9
House prices in L9 have an overall average of £154,247 over the last year.
The majority of properties sold in L9 during the last year were terraced properties, selling for an average price of £125,659. Semi-detached properties sold for an average of £177,445, with detached properties fetching £253,232.
Overall, the historical sold prices in L9 over the last year were 6% up on the previous year and 9% up on the 2022 peak of £141,870.
Properties Sold
10, Foxglove Close, Liverpool, Merseyside L9 6EG
| Today | See what it's worth now |
| 25 Feb 2025 | £148,000 |
| 30 Dec 2011 | £84,950 |
10, Lilford Avenue, Liverpool, Merseyside L9 3AT
| Today | See what it's worth now |
| 21 Feb 2025 | £135,000 |
| 15 Jun 2018 | £92,500 |
16, Danehurst Road, Liverpool, Merseyside L9 0ET


| Today | See what it's worth now |
| 21 Feb 2025 | £199,000 |
| 13 Nov 2020 | £112,000 |
38, Lynwood Road, Liverpool, Merseyside L9 3AF
| Today | See what it's worth now |
| 19 Feb 2025 | £135,000 |
No other historical records.
7, Allendale Avenue, Liverpool, Merseyside L9 0JX
| Today | See what it's worth now |
| 14 Feb 2025 | £145,575 |
| 17 Sep 2021 | £107,000 |
14, Long Lane, Walton, Liverpool, Merseyside L9 9AQ
| Today | See what it's worth now |
| 13 Feb 2025 | £138,000 |
| 25 Apr 2024 | £70,000 |
No other historical records.
124, Barlows Lane, Liverpool, Merseyside L9 9HY
| Today | See what it's worth now |
| 13 Feb 2025 | £150,000 |
| 14 Mar 2003 | £69,950 |
35, Primula Drive, Liverpool, Merseyside L9 1JR

| Today | See what it's worth now |
| 12 Feb 2025 | £115,000 |
| 29 Jul 2005 | £79,995 |
No other historical records.
24, Donsby Road, Liverpool, Merseyside L9 9AL
| Today | See what it's worth now |
| 11 Feb 2025 | £161,000 |
| 22 Dec 2016 | £110,000 |
21, Renwick Road, Liverpool, Merseyside L9 2DD
| Today | See what it's worth now |
| 3 Feb 2025 | £164,950 |
| 30 Jan 2020 | £133,000 |
87, Barlows Lane, Liverpool, Merseyside L9 9HZ
| Today | See what it's worth now |
| 3 Feb 2025 | £247,500 |
| 9 Sep 2019 | £180,000 |
253, Higher Lane, Liverpool, Merseyside L9 6EN
| Today | See what it's worth now |
| 31 Jan 2025 | £150,000 |
| 31 Aug 2007 | £142,999 |
No other historical records.
42, Garden Lane, Liverpool, Merseyside L9 9ED
| Today | See what it's worth now |
| 31 Jan 2025 | £285,000 |
| 20 Mar 1998 | £30,000 |
No other historical records.
36, Goodacre Road, Liverpool, Merseyside L9 0HQ
| Today | See what it's worth now |
| 31 Jan 2025 | £96,500 |
| 15 Dec 2010 | £82,500 |
25, Vale Lodge, Liverpool, Merseyside L9 1LR

| Today | See what it's worth now |
| 30 Jan 2025 | £80,000 |
| 5 Aug 2022 | £75,000 |
No other historical records.
57, Selby Road, Liverpool, Merseyside L9 8EB
| Today | See what it's worth now |
| 29 Jan 2025 | £175,000 |
| 30 Apr 2024 | £111,500 |
No other historical records.
19, Wensleydale, Liverpool, Merseyside L9 8DL
| Today | See what it's worth now |
| 20 Jan 2025 | £50,000 |
| 22 Aug 2002 | £50,950 |
21, Glenbank Close, Liverpool, Merseyside L9 2BR

| Today | See what it's worth now |
| 14 Jan 2025 | £112,000 |
No other historical records.
31, Wensley Road, Liverpool, Merseyside L9 8DN
| Today | See what it's worth now |
| 10 Jan 2025 | £190,000 |
| 19 Oct 2007 | £163,000 |
7, Inglis Road, Liverpool, Merseyside L9 0HL
| Today | See what it's worth now |
| 10 Jan 2025 | £120,000 |
| 24 Mar 2003 | £35,000 |
67, Ridgewood Way, Liverpool, Merseyside L9 8HJ

| Today | See what it's worth now |
| 10 Jan 2025 | £262,500 |
| 27 Mar 2019 | £182,495 |
No other historical records.
19, Cornett Road, Liverpool, Merseyside L9 0HH
| Today | See what it's worth now |
| 8 Jan 2025 | £136,500 |
| 29 Apr 2013 | £70,000 |
No other historical records.
17, Croft Lane, Liverpool, Merseyside L9 9DL
| Today | See what it's worth now |
| 8 Jan 2025 | £280,000 |
No other historical records.
51, Tynville Road, Liverpool, Merseyside L9 9BN
| Today | See what it's worth now |
| 7 Jan 2025 | £157,500 |
| 25 Aug 2020 | £112,000 |
26, Swallow Fields, Liverpool, Merseyside L9 6ED
| Today | See what it's worth now |
| 6 Jan 2025 | £166,000 |
No other historical records.
Find out how much your property is worth
The following agents can provide you with a free, no-obligation valuation. Simply select the ones you'd like to hear from.
Sponsored
All featured agents have paid a fee to promote their valuation expertise.

Logic
Liverpool

Grosvenor Waterford Estate Agents
Aintree

Whitegates
Walton Vale, Liverpool

Emperor Home
Liverpool

Entwistle Green
Walton Vale
Get ready with a Mortgage in Principle
- Personalised result in just 20 minutes
- Find out how much you can borrow
- Get viewings faster with agents
- No impact on your credit score
What's your property worth?
Source Acknowledgement: © Crown copyright. England and Wales house price data is publicly available information produced by the HM Land Registry.This material was last updated on 17 April 2025. It covers the period from 1 January 1995 to 28 February 2025 and contains property transactions which have been registered during that period. Contains HM Land Registry data © Crown copyright and database right 2025. This data is licensed under the Open Government Licence v3.0.
Disclaimer: Rightmove.co.uk provides this HM Land Registry data "as is". The burden for fitness of the data relies completely with the user and is provided for informational purposes only. No warranty, express or implied, is given relating to the accuracy of content of the HM Land Registry data and Rightmove does not accept any liability for error or omission. If you have found an error with the data or need further information please contact HM Land Registry.
Permitted Use: Viewers of this Information are granted permission to access this Crown copyright material and to download it onto electronic, magnetic, optical or similar storage media provided that such activities are for private research, study or in-house use only. Any other use of the material requires the formal written permission of Land Registry which can be requested from us, and is subject to an additional licence and associated charge.
Map data ©OpenStreetMap contributors.
Rightmove takes no liability for your use of, or reliance on, Rightmove's Instant Valuation due to the limitations of our tracking tool listed here. Use of this tool is taken entirely at your own risk. All rights reserved.