
House Prices in L36
House prices in L36 have an overall average of £186,308 over the last year.
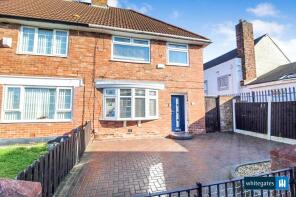
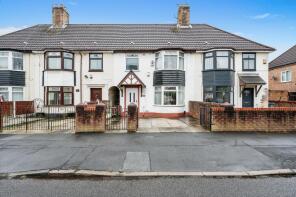
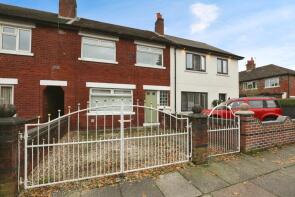
The majority of properties sold in L36 during the last year were semi-detached properties, selling for an average price of £195,244. Terraced properties sold for an average of £151,860, with detached properties fetching £271,225.
Overall, the historical sold prices in L36 over the last year were similar to the previous year and 4% up on the 2022 peak of £178,474.
Properties Sold
137, Pennard Avenue, Liverpool, Merseyside L36 3SH
| Today | See what it's worth now |
| 14 Feb 2025 | £125,000 |
| 1 Jun 2018 | £63,000 |
56, Rosebank Road, Huyton, Liverpool, Merseyside L36 3AB


| Today | See what it's worth now |
| 14 Feb 2025 | £184,000 |
| 28 Jun 2019 | £115,995 |
No other historical records.
3, Warwick Close, Liverpool, Merseyside L36 1UX
| Today | See what it's worth now |
| 14 Feb 2025 | £125,000 |
| 12 Dec 2005 | £79,950 |
No other historical records.
67, Attlee Road, Liverpool, Merseyside L36 6BG
| Today | See what it's worth now |
| 11 Feb 2025 | £190,000 |
| 30 Jul 2003 | £59,995 |
No other historical records.
9, Cassino Road, Liverpool, Merseyside L36 7UX
| Today | See what it's worth now |
| 3 Feb 2025 | £147,000 |
No other historical records.
36, Hazel Road, Liverpool, Merseyside L36 8ET
| Today | See what it's worth now |
| 3 Feb 2025 | £156,000 |
No other historical records.
36, Cartmel Road, Liverpool, Merseyside L36 3RY
| Today | See what it's worth now |
| 31 Jan 2025 | £142,000 |
| 21 Apr 2011 | £90,000 |
4, Lansbury Road, Liverpool, Merseyside L36 6BZ
| Today | See what it's worth now |
| 31 Jan 2025 | £157,000 |
| 21 May 2010 | £84,000 |
20, Beech Road, Huyton, Liverpool, Merseyside L36 5TS
| Today | See what it's worth now |
| 31 Jan 2025 | £150,000 |
| 30 Nov 2018 | £104,000 |
13, Cypress Road, Liverpool, Merseyside L36 5UN
| Today | See what it's worth now |
| 30 Jan 2025 | £302,000 |
| 24 Jun 2022 | £292,000 |
29, Laurel Grove, Huyton, Liverpool, Merseyside L36 5UD
| Today | See what it's worth now |
| 24 Jan 2025 | £327,500 |
| 26 Jul 2013 | £103,000 |
No other historical records.
9, Kingswood, Liverpool, Merseyside L36 2JY
| Today | See what it's worth now |
| 24 Jan 2025 | £175,000 |
| 7 Jun 2007 | £144,000 |
29, Overdale Road, Huyton, Liverpool, Merseyside L36 4AQ

| Today | See what it's worth now |
| 24 Jan 2025 | £375,000 |
| 31 Jul 2020 | £304,995 |
No other historical records.
58a, Reeds Road, Liverpool, Merseyside L36 7SW

| Today | See what it's worth now |
| 23 Jan 2025 | £39,900 |
| 24 May 1999 | £13,000 |
95, Oak Road, Liverpool, Merseyside L36 5XZ

| Today | See what it's worth now |
| 23 Jan 2025 | £350,000 |
| 5 Aug 1999 | £135,000 |
1, Crossvale Road, Liverpool, Merseyside L36 0UY
| Today | See what it's worth now |
| 22 Jan 2025 | £195,000 |
No other historical records.
42, Halebank Avenue, Huyton, Liverpool, Merseyside L36 4AP

| Today | See what it's worth now |
| 21 Jan 2025 | £244,000 |
| 31 Jan 2020 | £184,995 |
No other historical records.
99, Springfield Crescent, Liverpool, Merseyside L36 8FG

| Today | See what it's worth now |
| 20 Jan 2025 | £135,000 |
| 25 Jun 2021 | £114,000 |
45, Fernwood Avenue, Liverpool, Merseyside L36 8AL
| Today | See what it's worth now |
| 17 Jan 2025 | £225,000 |
| 29 Dec 2022 | £219,995 |
No other historical records.
15, Linden Drive, Liverpool, Merseyside L36 5TT
| Today | See what it's worth now |
| 17 Jan 2025 | £277,000 |
No other historical records.
76, York Road, Huyton, Liverpool, Merseyside L36 1XD
| Today | See what it's worth now |
| 17 Jan 2025 | £155,000 |
No other historical records.
16, Newark Close, Liverpool, Merseyside L36 8JD
| Today | See what it's worth now |
| 16 Jan 2025 | £180,000 |
| 27 Feb 1998 | £54,950 |
No other historical records.
10, Linden Drive, Liverpool, Merseyside L36 5TT

| Today | See what it's worth now |
| 15 Jan 2025 | £195,000 |
No other historical records.
10, Chester Walk, Liverpool, Merseyside L36 1UL

| Today | See what it's worth now |
| 15 Jan 2025 | £120,000 |
| 31 Jan 2003 | £55,000 |
No other historical records.
50, Hawthorn Road, Huyton, Liverpool, Merseyside L36 9TT
| Today | See what it's worth now |
| 10 Jan 2025 | £258,500 |
| 26 Sep 1997 | £50,000 |
No other historical records.
Find out how much your property is worth
The following agents can provide you with a free, no-obligation valuation. Simply select the ones you'd like to hear from.
Sponsored
All featured agents have paid a fee to promote their valuation expertise.

Reeds Rains
Prescot

Greenbank Property Services
Kirkby

Little Estate Agents
St Helens

Belvoir
Prescot

WiseMove
Covering Liverpool

Entwistle Green
Old Swan
Get ready with a Mortgage in Principle
- Personalised result in just 20 minutes
- Find out how much you can borrow
- Get viewings faster with agents
- No impact on your credit score
What's your property worth?
Source Acknowledgement: © Crown copyright. England and Wales house price data is publicly available information produced by the HM Land Registry.This material was last updated on 17 April 2025. It covers the period from 1 January 1995 to 28 February 2025 and contains property transactions which have been registered during that period. Contains HM Land Registry data © Crown copyright and database right 2025. This data is licensed under the Open Government Licence v3.0.
Disclaimer: Rightmove.co.uk provides this HM Land Registry data "as is". The burden for fitness of the data relies completely with the user and is provided for informational purposes only. No warranty, express or implied, is given relating to the accuracy of content of the HM Land Registry data and Rightmove does not accept any liability for error or omission. If you have found an error with the data or need further information please contact HM Land Registry.
Permitted Use: Viewers of this Information are granted permission to access this Crown copyright material and to download it onto electronic, magnetic, optical or similar storage media provided that such activities are for private research, study or in-house use only. Any other use of the material requires the formal written permission of Land Registry which can be requested from us, and is subject to an additional licence and associated charge.
Map data ©OpenStreetMap contributors.
Rightmove takes no liability for your use of, or reliance on, Rightmove's Instant Valuation due to the limitations of our tracking tool listed here. Use of this tool is taken entirely at your own risk. All rights reserved.