
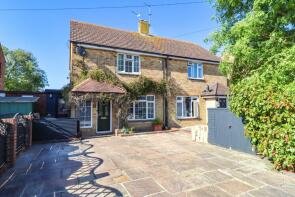
House Prices in Hayling Island
House prices in Hayling Island have an overall average of £371,161 over the last year.
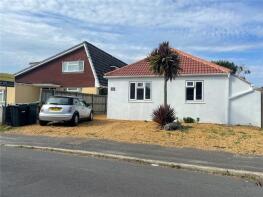
The majority of properties sold in Hayling Island during the last year were detached properties, selling for an average price of £483,134. Semi-detached properties sold for an average of £365,450, with flats fetching £171,271.
Overall, the historical sold prices in Hayling Island over the last year were 2% down on the previous year and 6% down on the 2021 peak of £394,959.
Properties Sold
49, Kings Road, Hayling Island, Hampshire PO11 0PD
| Today | See what it's worth now |
| 20 Feb 2025 | £345,000 |
| 28 Jul 2006 | £180,000 |
18, Gilbert Mead, Hayling Island, Hampshire PO11 0RE
| Today | See what it's worth now |
| 7 Feb 2025 | £320,000 |
| 11 Jun 2021 | £254,000 |
20, Webb Lane, Hayling Island, Hampshire PO11 9JE
| Today | See what it's worth now |
| 5 Feb 2025 | £425,000 |
| 26 Sep 2012 | £283,000 |
2, Katrina Gardens, Hayling Island, Hampshire PO11 0NW
| Today | See what it's worth now |
| 31 Jan 2025 | £300,000 |
| 8 Nov 2013 | £275,000 |
82a, Station Road, Hayling Island, Hampshire PO11 0EL
| Today | See what it's worth now |
| 31 Jan 2025 | £220,000 |
No other historical records.
43, Oakwood Road, Hayling Island, Hampshire PO11 9AY
| Today | See what it's worth now |
| 29 Jan 2025 | £345,000 |
| 3 May 2006 | £205,000 |
No other historical records.
12, Station Road, Hayling Island, Hampshire PO11 0EG
| Today | See what it's worth now |
| 24 Jan 2025 | £268,000 |
| 25 May 2004 | £146,000 |
No other historical records.
Greenside, Manor Road, Hayling Island, Hampshire PO11 0QU

| Today | See what it's worth now |
| 24 Jan 2025 | £385,000 |
| 15 Feb 2008 | £249,500 |
20, Southwood Road, Hayling Island, Hampshire PO11 9QD
| Today | See what it's worth now |
| 15 Jan 2025 | £240,000 |
| 8 Jun 2001 | £135,000 |
No other historical records.
17, Blackthorn Drive, Hayling Island, Hampshire PO11 9PA
| Today | See what it's worth now |
| 10 Jan 2025 | £375,000 |
| 26 Apr 2006 | £170,000 |
12, Marshall Road, Hayling Island, Hampshire PO11 9NH
| Today | See what it's worth now |
| 10 Jan 2025 | £370,000 |
| 11 Mar 2021 | £290,000 |
No other historical records.
76b, Elm Grove, Hayling Island, Hampshire PO11 9EH
| Today | See what it's worth now |
| 10 Jan 2025 | �£210,000 |
| 5 Nov 2001 | £84,500 |
Corfe Cottage, Copse Lane, Hayling Island, Hampshire PO11 0QA
| Today | See what it's worth now |
| 9 Jan 2025 | £455,000 |
| 29 Oct 2018 | £455,000 |
No other historical records.
11, St Andrews Road, Hayling Island, Hampshire PO11 9JN
| Today | See what it's worth now |
| 3 Jan 2025 | £431,500 |
| 24 Oct 2014 | £305,000 |
No other historical records.
35, Elm Grove, Hayling Island, Hampshire PO11 9EA
| Today | See what it's worth now |
| 18 Dec 2024 | £222,000 |
No other historical records.
7, Richmond Drive, Hayling Island, Hampshire PO11 0EP
| Today | See what it's worth now |
| 18 Dec 2024 | £470,000 |
| 10 Sep 2001 | £162,000 |
No other historical records.
Flat 8, Silversands Court, 12 - 14, Hollow Lane, Hayling Island, Hampshire PO11 9FH


| Today | See what it's worth now |
| 18 Dec 2024 | £200,000 |
| 14 Dec 2012 | £178,000 |
15, Sandeman Grove, Hayling Island, Hampshire PO11 0FT

| Today | See what it's worth now |
| 18 Dec 2024 | £367,000 |
| 30 Jun 2023 | £347,500 |
No other historical records.
38, St Marys Road, Hayling Island, Hampshire PO11 9DB
| Today | See what it's worth now |
| 18 Dec 2024 | £825,000 |
No other historical records.
Flat 1, Mary Coombs Court, 2a, Sea Grove Avenue, Hayling Island, Hampshire PO11 9FJ

| Today | See what it's worth now |
| 16 Dec 2024 | £123,000 |
No other historical records.
11, Palmerston Road, Hayling Island, Hampshire PO11 9ET
| Today | See what it's worth now |
| 13 Dec 2024 | £312,500 |
No other historical records.
1, Sandy Beach Estate, Hayling Island, Hampshire PO11 9RG
| Today | See what it's worth now |
| 13 Dec 2024 | £485,000 |
| 13 Aug 2020 | £365,000 |
No other historical records.
21, Sandy Point Road, Hayling Island, Hampshire PO11 9RP
| Today | See what it's worth now |
| 13 Dec 2024 | £325,000 |
| 3 Feb 2006 | £249,950 |
Laetare, Selsmore Road, Hayling Island, Hampshire PO11 9JZ
| Today | See what it's worth now |
| 12 Dec 2024 | £472,500 |
| 12 Nov 2020 | £430,000 |
No other historical records.
Flat 6, Anchor Court, 80, Southwood Road, Hayling Island, Hampshire PO11 9UR

| Today | See what it's worth now |
| 12 Dec 2024 | £152,500 |
| 13 Apr 2004 | £112,500 |
Get ready with a Mortgage in Principle
- Personalised result in just 20 minutes
- Find out how much you can borrow
- Get viewings faster with agents
- No impact on your credit score
What's your property worth?
Source Acknowledgement: © Crown copyright. England and Wales house price data is publicly available information produced by the HM Land Registry.This material was last updated on 17 April 2025. It covers the period from 1 January 1995 to 28 February 2025 and contains property transactions which have been registered during that period. Contains HM Land Registry data © Crown copyright and database right 2025. This data is licensed under the Open Government Licence v3.0.
Disclaimer: Rightmove.co.uk provides this HM Land Registry data "as is". The burden for fitness of the data relies completely with the user and is provided for informational purposes only. No warranty, express or implied, is given relating to the accuracy of content of the HM Land Registry data and Rightmove does not accept any liability for error or omission. If you have found an error with the data or need further information please contact HM Land Registry.
Permitted Use: Viewers of this Information are granted permission to access this Crown copyright material and to download it onto electronic, magnetic, optical or similar storage media provided that such activities are for private research, study or in-house use only. Any other use of the material requires the formal written permission of Land Registry which can be requested from us, and is subject to an additional licence and associated charge.
Map data ©OpenStreetMap contributors.
Rightmove takes no liability for your use of, or reliance on, Rightmove's Instant Valuation due to the limitations of our tracking tool listed here. Use of this tool is taken entirely at your own risk. All rights reserved.