
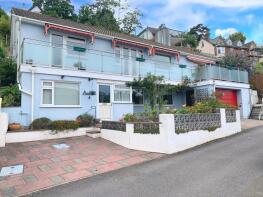
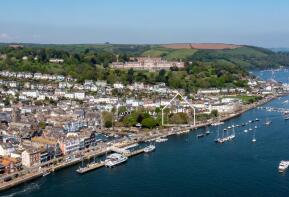
House Prices in Dartmouth
House prices in Dartmouth have an overall average of £442,833 over the last year.
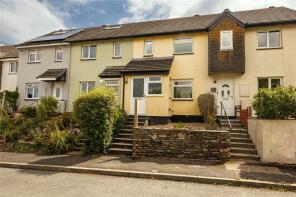
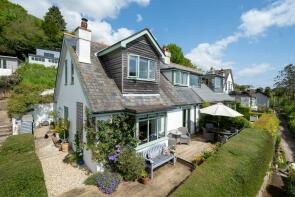
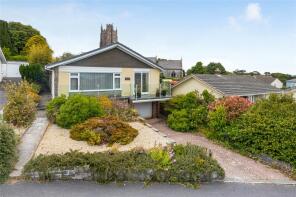
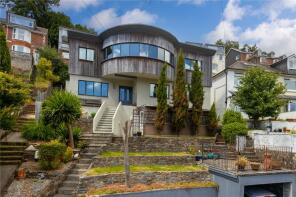
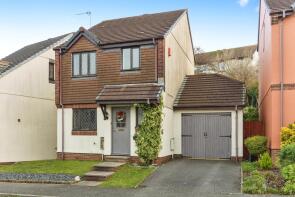
The majority of properties sold in Dartmouth during the last year were terraced properties, selling for an average price of £392,000. Detached properties sold for an average of £657,079, with flats fetching £359,737.
Overall, the historical sold prices in Dartmouth over the last year were 2% down on the previous year and 6% down on the 2021 peak of £470,841.
Properties Sold
29, Townstal Crescent, Dartmouth, Devon TQ6 9JL


| Today | See what it's worth now |
| 4 Feb 2025 | £195,000 |
| 20 Nov 1996 | £65,000 |
No other historical records.
Flat 6, Hillside Court, 114, Victoria Road, Dartmouth, Devon TQ6 9EG

| Today | See what it's worth now |
| 27 Jan 2025 | £205,000 |
| 25 Jul 2022 | £152,000 |
219, Victoria Road, Dartmouth, Devon TQ6 9EQ
| Today | See what it's worth now |
| 22 Jan 2025 | £305,000 |
No other historical records.
34, Clarence Hill, Dartmouth, Devon TQ6 9NY
| Today | See what it's worth now |
| 17 Jan 2025 | £600,000 |
| 2 Jun 2014 | £419,950 |
1, Northford Road, Dartmouth, Devon TQ6 9EP
| Today | See what it's worth now |
| 13 Jan 2025 | £370,000 |
| 27 Mar 2018 | £315,000 |
19, Church Road, Dartmouth, Devon TQ6 9HQ
| Today | See what it's worth now |
| 9 Jan 2025 | £265,000 |
| 29 Mar 2018 | £196,000 |
No other historical records.
20, Mill Crescent, Dartmouth, Devon TQ6 9TA
| Today | See what it's worth now |
| 18 Dec 2024 | £217,000 |
| 24 Aug 2001 | £65,000 |
No other historical records.
49a, Victoria Road, Dartmouth, Devon TQ6 9RT
| Today | See what it's worth now |
| 5 Dec 2024 | £245,000 |
| 20 Apr 2015 | £173,000 |
3, Kingston Lane, Dartmouth, Devon TQ6 9HB
| Today | See what it's worth now |
| 27 Nov 2024 | £475,000 |
| 7 Oct 2016 | £265,000 |
4, Churchfields, Dartmouth, Devon TQ6 9HH
| Today | See what it's worth now |
| 21 Nov 2024 | £485,000 |
| 15 Oct 2020 | £475,000 |
9, Barton Way, Dartmouth, Devon TQ6 0FL

| Today | See what it's worth now |
| 20 Nov 2024 | £615,000 |
| 30 Sep 2021 | £534,995 |
No other historical records.
52, Victoria Road, Dartmouth, Devon TQ6 9DZ

| Today | See what it's worth now |
| 15 Nov 2024 | £698,000 |
No other historical records.
Stonewalls, 29, Townstal Pathfields, Dartmouth, Devon TQ6 9HL

| Today | See what it's worth now |
| 14 Nov 2024 | £770,000 |
| 9 Dec 2014 | £380,000 |
No other historical records.
Speedwell, Lower Fairview Road, Dartmouth, Devon TQ6 9EE
| Today | See what it's worth now |
| 7 Nov 2024 | £785,000 |
| 6 Nov 2020 | £520,000 |
No other historical records.
Flat 6, Dartmouth House, Mayors Avenue, Dartmouth, Devon TQ6 9PX
| Today | See what it's worth now |
| 29 Oct 2024 | £350,000 |
| 12 May 2000 | £110,000 |
No other historical records.
3, Ashleigh Gardens, Dartmouth, Devon TQ6 9HQ

| Today | See what it's worth now |
| 29 Oct 2024 | £715,000 |
| 31 May 2012 | £430,000 |
Solquest, Lower Fairview Road, Dartmouth, Devon TQ6 9EE
| Today | See what it's worth now |
| 17 Oct 2024 | �£695,000 |
| 6 May 2010 | £330,000 |
40, Seymour Drive, Dartmouth, Devon TQ6 9GB
| Today | See what it's worth now |
| 10 Oct 2024 | £310,000 |
| 4 Sep 1998 | £75,000 |
No other historical records.
42, Britannia Avenue, Dartmouth, Devon TQ6 9JS
| Today | See what it's worth now |
| 10 Oct 2024 | £270,000 |
| 8 Apr 2016 | £170,000 |
7, Swan Court, Victoria Road, Dartmouth, Devon TQ6 9EA

| Today | See what it's worth now |
| 8 Oct 2024 | £119,000 |
No other historical records.
Flat, 3, Smith Street, Dartmouth, Devon TQ6 9QR

| Today | See what it's worth now |
| 4 Oct 2024 | £185,000 |
No other historical records.
11, Mount Boone Way, Dartmouth, Devon TQ6 9PL

| Today | See what it's worth now |
| 30 Sep 2024 | £785,000 |
No other historical records.
44, Barton Way, Dartmouth, Devon TQ6 0FL

| Today | See what it's worth now |
| 19 Sep 2024 | £274,995 |
No other historical records.
407, Norton Park, Norton, Dartmouth, Devon TQ6 0NH

| Today | See what it's worth now |
| 6 Sep 2024 | £44,000 |
No other historical records.
165, Victoria Road, Dartmouth, Devon TQ6 9EF
| Today | See what it's worth now |
| 6 Sep 2024 | £339,995 |
| 17 Dec 2018 | £218,000 |
Get ready with a Mortgage in Principle
- Personalised result in just 20 minutes
- Find out how much you can borrow
- Get viewings faster with agents
- No impact on your credit score
What's your property worth?
Source Acknowledgement: © Crown copyright. England and Wales house price data is publicly available information produced by the HM Land Registry.This material was last updated on 17 April 2025. It covers the period from 1 January 1995 to 28 February 2025 and contains property transactions which have been registered during that period. Contains HM Land Registry data © Crown copyright and database right 2025. This data is licensed under the Open Government Licence v3.0.
Disclaimer: Rightmove.co.uk provides this HM Land Registry data "as is". The burden for fitness of the data relies completely with the user and is provided for informational purposes only. No warranty, express or implied, is given relating to the accuracy of content of the HM Land Registry data and Rightmove does not accept any liability for error or omission. If you have found an error with the data or need further information please contact HM Land Registry.
Permitted Use: Viewers of this Information are granted permission to access this Crown copyright material and to download it onto electronic, magnetic, optical or similar storage media provided that such activities are for private research, study or in-house use only. Any other use of the material requires the formal written permission of Land Registry which can be requested from us, and is subject to an additional licence and associated charge.
Map data ©OpenStreetMap contributors.
Rightmove takes no liability for your use of, or reliance on, Rightmove's Instant Valuation due to the limitations of our tracking tool listed here. Use of this tool is taken entirely at your own risk. All rights reserved.