
House Prices in Corringham
House prices in Corringham have an overall average of £377,034 over the last year.
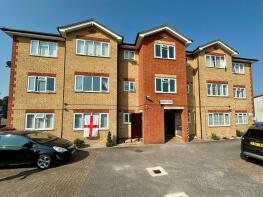
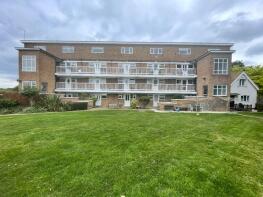
The majority of properties sold in Corringham during the last year were semi-detached properties, selling for an average price of £393,147. Terraced properties sold for an average of £339,791, with flats fetching £190,409.
Overall, the historical sold prices in Corringham over the last year were similar to the previous year and similar to the 2022 peak of £373,564.
Properties Sold
5, The Glen, Stanford-le-hope, Thurrock SS17 7EA
| Today | See what it's worth now |
| 21 Feb 2025 | £300,000 |
| 8 Oct 2012 | £173,000 |
10, Jefferies Way, Stanford-le-hope, Thurrock SS17 7DT
| Today | See what it's worth now |
| 18 Feb 2025 | £362,500 |
| 27 Feb 2019 | £260,000 |
151, Oxwich Close, Corringham, Stanford-le-hope, Thurrock SS17 7JZ
| Today | See what it's worth now |
| 13 Feb 2025 | £325,000 |
| 24 Jul 1995 | £47,000 |
No other historical records.
12, Clarence Road, Corringham, Stanford-le-hope, Thurrock SS17 9BL
| Today | See what it's worth now |
| 7 Feb 2025 | £395,000 |
No other historical records.
Flat 12, Rosslyn House, Springhouse Road, Corringham, Stanford-le-hope, Thurrock SS17 7QR
| Today | See what it's worth now |
| 31 Jan 2025 | £170,000 |
| 12 Feb 1998 | £42,000 |
No other historical records.
187, Bellmaine Avenue, Corringham, Stanford-le-hope, Thurrock SS17 7SZ
| Today | See what it's worth now |
| 24 Jan 2025 | £325,000 |
| 28 Aug 2014 | £192,000 |
9, Allistonway, Stanford-le-hope, Thurrock SS17 7HY
| Today | See what it's worth now |
| 13 Jan 2025 | £310,000 |
No other historical records.
12, Larkfield, Corringham, Stanford-le-hope, Thurrock SS17 9EA
| Today | See what it's worth now |
| 6 Jan 2025 | £330,000 |
No other historical records.
18, Finches Close, Corringham, Stanford-le-hope, Thurrock SS17 9BX
| Today | See what it's worth now |
| 20 Dec 2024 | £212,000 |
| 28 Jun 2000 | £31,735 |
No other historical records.
Brions, High Road, Fobbing, Stanford-le-hope, Thurrock SS17 9HY
| Today | See what it's worth now |
| 16 Dec 2024 | £582,500 |
No other historical records.
209, Bracelet Close, Corringham, Stanford-le-hope, Thurrock SS17 7JX
| Today | See what it's worth now |
| 16 Dec 2024 | £310,000 |
| 7 Dec 2007 | £170,000 |
11, Birchwood Road, Corringham, Stanford-le-hope, Thurrock SS17 9ED
| Today | See what it's worth now |
| 12 Dec 2024 | £455,000 |
| 7 Oct 2016 | £345,000 |
11, Larkfield, Corringham, Stanford-le-hope, Thurrock SS17 9EA
| Today | See what it's worth now |
| 10 Dec 2024 | £410,000 |
No other historical records.
9, Elmstead Close, Corringham, Stanford-le-hope, Thurrock SS17 9EL
| Today | See what it's worth now |
| 6 Dec 2024 | £442,000 |
| 13 Sep 2018 | £285,000 |
108, Digby Road, Corringham, Stanford-le-hope, Thurrock SS17 9BU
| Today | See what it's worth now |
| 29 Nov 2024 | £337,500 |
| 31 Oct 2008 | £160,000 |
No other historical records.
31, Elmstead Close, Corringham, Stanford-le-hope, Thurrock SS17 9EL
| Today | See what it's worth now |
| 29 Nov 2024 | £307,000 |
| 11 Aug 2014 | £195,000 |
No other historical records.
304, Pendine Close, Corringham, Stanford-le-hope, Thurrock SS17 7JS
| Today | See what it's worth now |
| 22 Nov 2024 | £207,500 |
| 12 Nov 2007 | £135,000 |
No other historical records.
32, Allensway, Stanford-le-hope, Thurrock SS17 7HA
| Today | See what it's worth now |
| 22 Nov 2024 | £380,000 |
| 18 Aug 2016 | £310,000 |
58, Laburnum Drive, Corringham, Stanford-le-hope, Thurrock SS17 7QF
| Today | See what it's worth now |
| 22 Nov 2024 | £440,000 |
| 12 May 2008 | £204,995 |
No other historical records.
11, Warburtons, Stanford-le-hope, Thurrock SS17 7HR
| Today | See what it's worth now |
| 15 Nov 2024 | £356,000 |
| 30 Apr 1996 | £67,500 |
No other historical records.
38, Andersons, Stanford-le-hope, Thurrock SS17 7JF
| Today | See what it's worth now |
| 15 Nov 2024 | £339,000 |
| 28 Sep 2021 | £326,000 |
No other historical records.
18, Woodmanhurst Road, Corringham, Stanford-le-hope, Thurrock SS17 7RX
| Today | See what it's worth now |
| 15 Nov 2024 | £360,000 |
| 13 Nov 2020 | £320,000 |
No other historical records.
3, York Avenue, Corringham, Stanford-le-hope, Thurrock SS17 7NP
| Today | See what it's worth now |
| 15 Nov 2024 | £375,000 |
| 4 Jan 2002 | £94,995 |
No other historical records.
Braemount, Lion Hill, Fobbing, Stanford-le-hope, Thurrock SS17 9JR
| Today | See what it's worth now |
| 15 Nov 2024 | £467,500 |
| 21 Feb 2008 | £345,000 |
No other historical records.
109, Caswell Close, Corringham, Stanford-le-hope, Thurrock SS17 7LA
| Today | See what it's worth now |
| 11 Nov 2024 | £345,000 |
| 26 May 1995 | £44,500 |
No other historical records.
Get ready with a Mortgage in Principle
- Personalised result in just 20 minutes
- Find out how much you can borrow
- Get viewings faster with agents
- No impact on your credit score
What's your property worth?
Source Acknowledgement: © Crown copyright. England and Wales house price data is publicly available information produced by the HM Land Registry.This material was last updated on 17 April 2025. It covers the period from 1 January 1995 to 28 February 2025 and contains property transactions which have been registered during that period. Contains HM Land Registry data © Crown copyright and database right 2025. This data is licensed under the Open Government Licence v3.0.
Disclaimer: Rightmove.co.uk provides this HM Land Registry data "as is". The burden for fitness of the data relies completely with the user and is provided for informational purposes only. No warranty, express or implied, is given relating to the accuracy of content of the HM Land Registry data and Rightmove does not accept any liability for error or omission. If you have found an error with the data or need further information please contact HM Land Registry.
Permitted Use: Viewers of this Information are granted permission to access this Crown copyright material and to download it onto electronic, magnetic, optical or similar storage media provided that such activities are for private research, study or in-house use only. Any other use of the material requires the formal written permission of Land Registry which can be requested from us, and is subject to an additional licence and associated charge.
Map data ©OpenStreetMap contributors.
Rightmove takes no liability for your use of, or reliance on, Rightmove's Instant Valuation due to the limitations of our tracking tool listed here. Use of this tool is taken entirely at your own risk. All rights reserved.