
House Prices in Charlton
House prices in Charlton have an overall average of £332,373 over the last year.
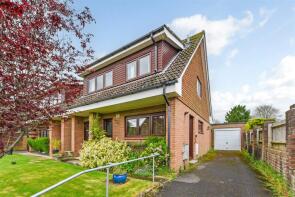
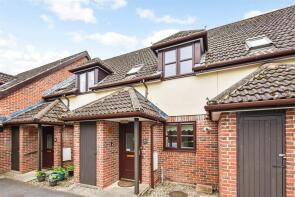
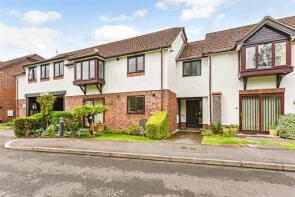
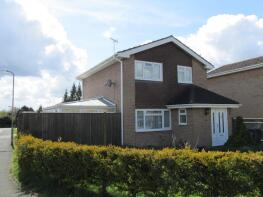
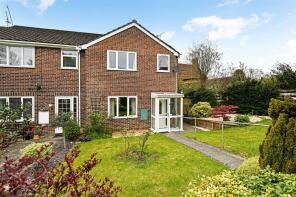
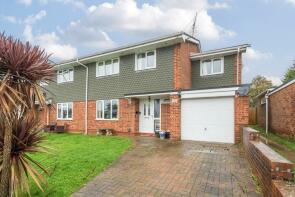
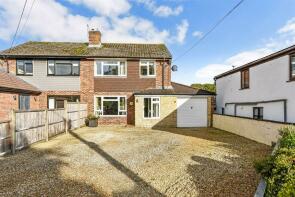
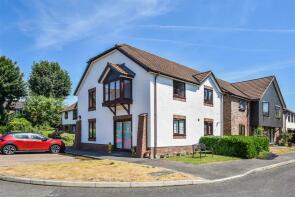
The majority of properties sold in Charlton during the last year were terraced properties, selling for an average price of £286,806. Detached properties sold for an average of £448,750, with semi-detached properties fetching £364,833.
Overall, the historical sold prices in Charlton over the last year were 6% down on the previous year and 4% down on the 2019 peak of £347,265.
Properties Sold
11, Tower Close, Charlton, Andover, Hampshire SP10 4RS
| Today | See what it's worth now |
| 10 Feb 2025 | £400,000 |
| 28 Mar 2013 | £250,000 |
30, Carters Meadow, Charlton, Andover, Hampshire SP10 4AF
| Today | See what it's worth now |
| 17 Dec 2024 | £206,000 |
| 18 Aug 2017 | £199,950 |
25, Bede Drive, Charlton, Andover, Hampshire SP10 4EQ
| Today | See what it's worth now |
| 13 Dec 2024 | £335,000 |
| 13 Apr 2017 | £238,000 |
No other historical records.
18, Carters Meadow, Charlton, Andover, Hampshire SP10 4AF
| Today | See what it's worth now |
| 13 Dec 2024 | £235,000 |
| 29 Mar 2019 | £210,000 |
14, Mercia Avenue, Charlton, Andover, Hampshire SP10 4EJ
| Today | See what it's worth now |
| 9 Dec 2024 | £360,000 |
| 22 Sep 2003 | £210,000 |
No other historical records.
57, Carters Meadow, Charlton, Andover, Hampshire SP10 4AF
| Today | See what it's worth now |
| 2 Dec 2024 | £285,000 |
| 22 Nov 2006 | £198,500 |
31, Carters Meadow, Charlton, Andover, Hampshire SP10 4AF
| Today | See what it's worth now |
| 11 Nov 2024 | £177,500 |
| 11 Dec 1997 | £90,450 |
No other historical records.
41, Peake Way, Charlton, Andover, Hampshire SP10 4FA


| Today | See what it's worth now |
| 6 Nov 2024 | £350,000 |
| 27 Sep 2018 | £280,000 |
No other historical records.
1, Litchfield Close, Charlton, Andover, Hampshire SP10 4RR
| Today | See what it's worth now |
| 18 Oct 2024 | £395,000 |
| 26 Oct 2012 | £229,000 |
7, Home Farm Gardens, Charlton, Andover, Hampshire SP10 4AX
| Today | See what it's worth now |
| 11 Oct 2024 | £360,000 |
| 25 Nov 1996 | £82,500 |
No other historical records.
83, Carters Meadow, Charlton, Andover, Hampshire SP10 4AE
| Today | See what it's worth now |
| 4 Oct 2024 | �£200,000 |
| 8 Jun 2020 | £172,000 |
Walnut Tree Cottage, 66, Charlton, Andover, Hampshire SP10 4AP

| Today | See what it's worth now |
| 17 Sep 2024 | £677,500 |
| 14 Nov 2019 | £550,000 |
No other historical records.
72, Mercia Avenue, Charlton, Andover, Hampshire SP10 4HA

| Today | See what it's worth now |
| 16 Sep 2024 | £250,000 |
| 7 Aug 2009 | £148,000 |
No other historical records.
3, Hillside Gardens, Andover, Hampshire SP10 4EW

| Today | See what it's worth now |
| 30 Aug 2024 | £332,500 |
| 28 Jun 2017 | £319,950 |
No other historical records.
21, Tower Close, Charlton, Andover, Hampshire SP10 4RS

| Today | See what it's worth now |
| 15 Aug 2024 | £335,000 |
| 8 Aug 2016 | £247,000 |
No other historical records.
4, Augustine Way, Charlton, Andover, Hampshire SP10 4EG

| Today | See what it's worth now |
| 15 Aug 2024 | £510,000 |
No other historical records.
23, Carters Meadow, Charlton, Andover, Hampshire SP10 4AF

| Today | See what it's worth now |
| 5 Jul 2024 | £217,500 |
| 16 Dec 2013 | £170,000 |
26, Armstrong Rise, Charlton, Andover, Hampshire SP10 4ED

| Today | See what it's worth now |
| 5 Jul 2024 | £270,000 |
| 21 Mar 2017 | £193,000 |
39, St Thomas Close, Charlton, Andover, Hampshire SP10 4DY
| Today | See what it's worth now |
| 28 Jun 2024 | £390,000 |
| 23 Feb 1996 | £69,750 |
No other historical records.
45, Armstrong Rise, Charlton, Andover, Hampshire SP10 4EB

| Today | See what it's worth now |
| 24 May 2024 | £262,000 |
| 16 Oct 2015 | £186,000 |
67, Hatherden Road, Charlton, Andover, Hampshire SP10 4AP
| Today | See what it's worth now |
| 20 May 2024 | £350,000 |
No other historical records.
4, Wetherby Gardens, Charlton, Andover, Hampshire SP10 4DH
| Today | See what it's worth now |
| 3 May 2024 | £299,950 |
| 2 Nov 2007 | £218,950 |
22, Home Farm Gardens, Charlton, Andover, Hampshire SP10 4AX
| Today | See what it's worth now |
| 17 Apr 2024 | £389,000 |
No other historical records.
83, Hatherden Road, Charlton, Andover, Hampshire SP10 4AW
| Today | See what it's worth now |
| 9 Apr 2024 | £390,000 |
| 7 Apr 2000 | £117,000 |
45, Carters Meadow, Charlton, Andover, Hampshire SP10 4AF
| Today | See what it's worth now |
| 15 Mar 2024 | £160,000 |
| 13 Jul 2012 | £149,000 |
Get ready with a Mortgage in Principle
- Personalised result in just 20 minutes
- Find out how much you can borrow
- Get viewings faster with agents
- No impact on your credit score
What's your property worth?
Source Acknowledgement: © Crown copyright. England and Wales house price data is publicly available information produced by the HM Land Registry.This material was last updated on 17 April 2025. It covers the period from 1 January 1995 to 28 February 2025 and contains property transactions which have been registered during that period. Contains HM Land Registry data © Crown copyright and database right 2025. This data is licensed under the Open Government Licence v3.0.
Disclaimer: Rightmove.co.uk provides this HM Land Registry data "as is". The burden for fitness of the data relies completely with the user and is provided for informational purposes only. No warranty, express or implied, is given relating to the accuracy of content of the HM Land Registry data and Rightmove does not accept any liability for error or omission. If you have found an error with the data or need further information please contact HM Land Registry.
Permitted Use: Viewers of this Information are granted permission to access this Crown copyright material and to download it onto electronic, magnetic, optical or similar storage media provided that such activities are for private research, study or in-house use only. Any other use of the material requires the formal written permission of Land Registry which can be requested from us, and is subject to an additional licence and associated charge.
Map data ©OpenStreetMap contributors.
Rightmove takes no liability for your use of, or reliance on, Rightmove's Instant Valuation due to the limitations of our tracking tool listed here. Use of this tool is taken entirely at your own risk. All rights reserved.