- How have we looked at the data?
- Introduction from Andy Miles
- Leasing market: data at a glance and key takeaways
- Quarterly spotlight: industrial leasing
- Leasing market: sector summaries
- Investment market: data at a glance and key takeaways
- Investment market: sector summaries
How have we looked at the data?
- All data compares 1st April 2024 – 30th June 2024 with the same period a year ago
- Demand definition: all enquiries to commercial agents about listings for lease, or to invest in via Rightmove
- Supply definition: the number of available commercial real estate listings for lease or investment on Rightmove, adjusted to strip out the effect of any growth in our partner base
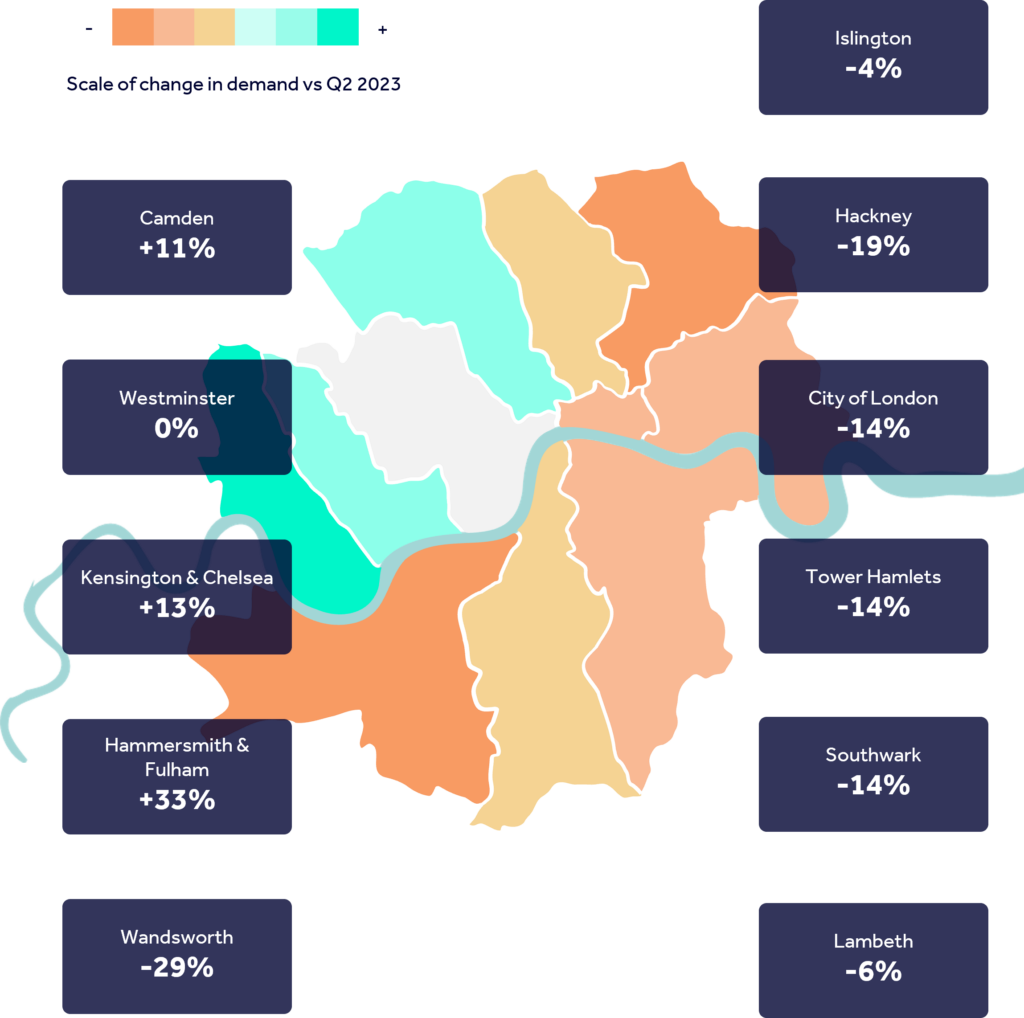
- Colour key: Teal colours represent areas with more growth in demand or available listings than a year ago, while red shaded areas represent less demand or available listings than a year ago
- The heat maps compare industrial leasing demand in Q2 2024 with the same period a year ago.
About our report
- We acknowledge that some market participants will look at demand and supply differently, for example as an aggregate of active searches by tenant representatives, measured in square feet. We aim to provide an alternative lens that makes the best use of our unique dataset.
Introduction

We’re the UK’s number one commercial real estate destination and our vision is to give everyone the belief that they can make their move.
Commercial real estate on Rightmove is seen by the largest and most engaged audience in the UK, and we’ve analysed millions of data points from this audience. These high-level trends help us to see what’s happening in the sectors and sub-sectors of the market.
We hope you find these insights useful to complement your own market data.
Andy Miles, Rightmove’s MD of Commercial Real Estate
Leasing market: data at a glance and key takeaways
Data at a glance
Key takeaways
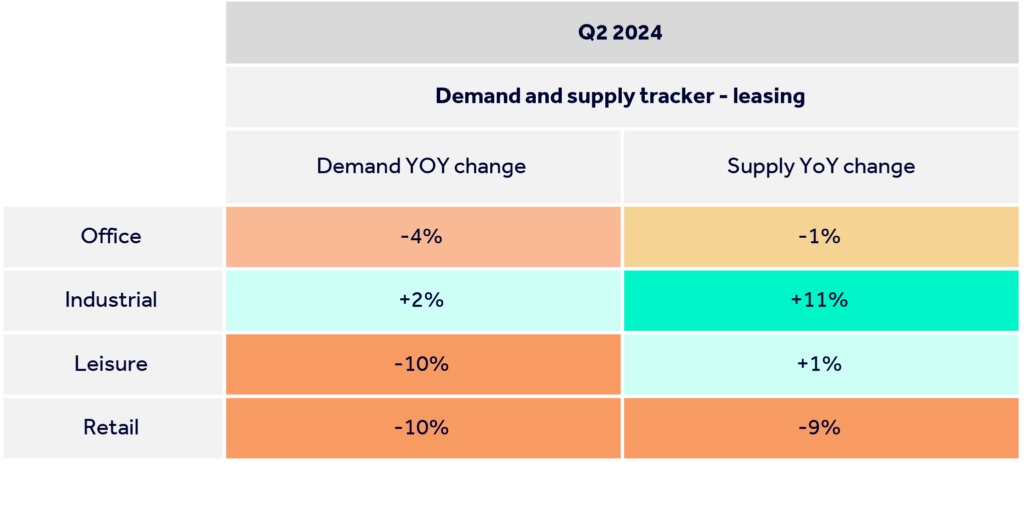
▲2%
Industrial has seen a 2% increase in demand this quarter, the only sector with demand higher than a year ago, though still muted
▼10%
Leisure and Retail are the weakest performing sectors, with a 10% decrease in demand compared with Q2 2023
▲11%
The industrial sector has seen the biggest improvement in available supply, with the level of listings 11% higher than Q2 last year
Quarterly spotlight: industrial leasing
“The industrial sector is the only area we are seeing a greater number of enquiries to listings compared to the same period last year, and we’re also seeing the biggest growth in listings in this sector.
“The sharp drop in demand for industrial space for leasing in London is the reason that this quarter’s overall demand figure is not more positive.”
Andy Miles, Rightmove’s MD of Commercial Real Estate
Regional industrial demand
London office demand
Leasing market: sector summaries
Office
- Demand in the office sector is down by 4% compared to Q2 2023, while supply is down by 1%.
- Whilst office demand is down overall, in the serviced office sector, demand is up by 10% compared with Q2 2023.
- Though office supply is down overall, one sector to pick out is serviced offices, which are up 14% in supply compared with this time last year.
Industrial
- Demand for industrial space is up by 2% this quarter compared to the same period last year, while supply is up by 11%
- Warehouses and industrial parks are two of the main drivers of demand growth this quarter, while comparatively demand for light industrial units is down by 3%
- On the supply side, there’s growth from a mix of areas
Leisure
- In the leisure sector, demand is down by 10% compared with Q2 2023, while supply is up by 1%
- Café’s and restaurants are two of the main drivers of the drop in demand compared with last year
- Highstreet leisure facilities including pubs, cafes and restaurants are down on supply vs this time last year
Retail
- Demand for retail spaces to lease is down by 10% on Q2 2023, while supply is down by 9%
- There’s a drop in demand for retail high street units and shops but there has been an increase in demand for workshop retail spaces
- A decline in shop and high street retail listings are the primary drivers of the drop in overall retail supply vs last year
Investment market: data at a glance and key takeaways
Data at a glance
Key takeaways
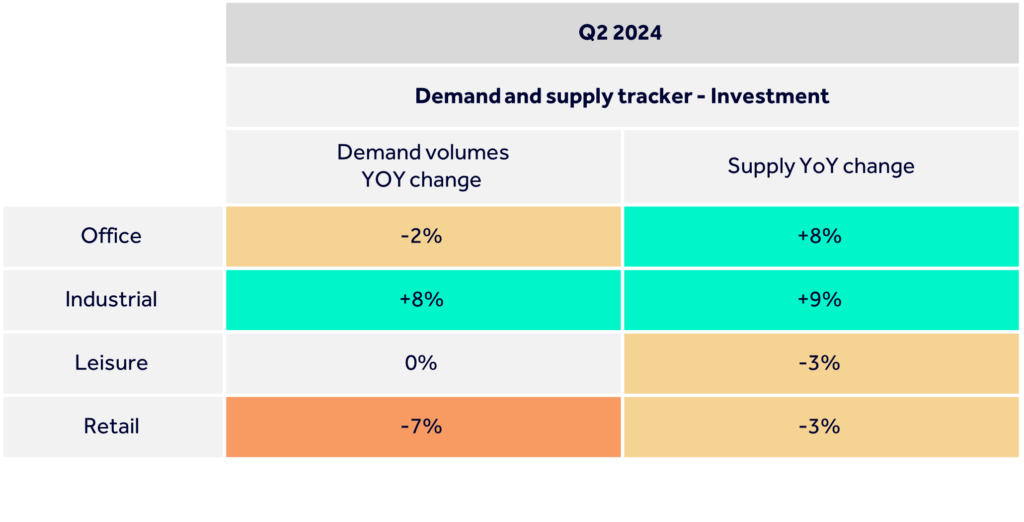
▲8%
Industrial is the strongest performing sector, with an 8% increase in demand
▼10%
Retail is the weakest performing sector, with a 7% decrease in demand
▲9%
The industrial sector has seen the biggest improvement in available supply, with the level of listings 9% higher than Q2 last year.
Investment market: sector summaries
Office
- Demand is down by 2% compared with Q2 2023, while supply is up by 8%
- Both demand and supply trends improve this quarter from Q1
Industrial
- Demand for industrial space is up by 8% compared to Q2 2023, while supply is up by 9%
- Distribution warehouses are the biggest driver behind the growth in supply this quarter
- Growth in demand for light industrial units of +10% has led to the increase in demand in this sector vs Q2 2023
Leisure
- Demand is flat in the leisure sector this quarter, while the number of listings sees a slight dip of 3%
- A decline in café and restaurant listings are the main drivers behind the overall drop in leisure listings vs last year
- Cafés have seen a drop in demand, and leisure facilities have seen an increase in demand vs last year
Retail
- Retail demand is down by 7% this quarter compared to the same period last year, while supply is down by 3%
- Demand and supply trends have headed downwards from Q1
- One area to highlight is out of town retail units, which have seen an increase of 14% in demand compared with last year
Copyright © 2000-2026 Rightmove Group Limited. All rights reserved. Rightmove prohibits the scraping of its content. You can find further details here.
